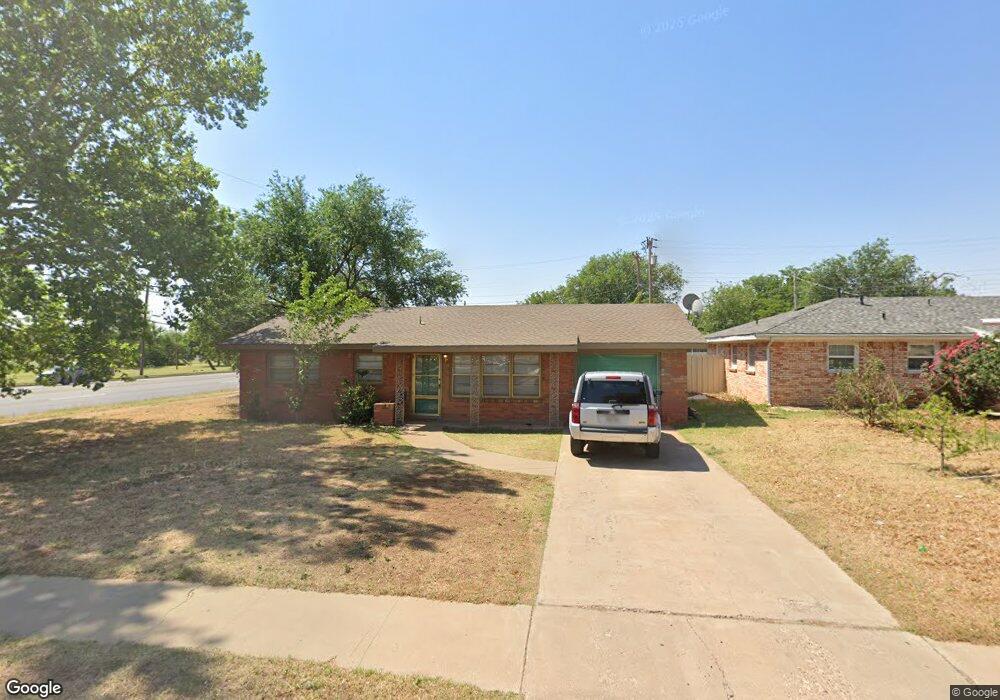
4401 26th St Lubbock, TX 79410
Coronado NeighborhoodEstimated Value: $157,000 - $184,000
3
Beds
2
Baths
1,364
Sq Ft
$124/Sq Ft
Est. Value
About This Home
This home is located at 4401 26th St, Lubbock, TX 79410 and is currently estimated at $168,986, approximately $123 per square foot. 4401 26th St is a home located in Lubbock County with nearby schools including Overton Elementary School, Commander William C. McCool Academy, and Mackenzie Middle School.
Ownership History
Date
Name
Owned For
Owner Type
Purchase Details
Closed on
Aug 19, 2016
Sold by
Hutcherson Michael and Estate Of Peggy Temple Wall
Bought by
Csk Properties Ltd
Current Estimated Value
Home Financials for this Owner
Home Financials are based on the most recent Mortgage that was taken out on this home.
Original Mortgage
$60,173
Outstanding Balance
$47,918
Interest Rate
3.42%
Mortgage Type
Purchase Money Mortgage
Estimated Equity
$121,068
Purchase Details
Closed on
Dec 13, 2005
Sold by
Richardson Thetis L Estate
Bought by
Csk Properties Ltd
Create a Home Valuation Report for This Property
The Home Valuation Report is an in-depth analysis detailing your home's value as well as a comparison with similar homes in the area
Home Values in the Area
Average Home Value in this Area
Purchase History
| Date | Buyer | Sale Price | Title Company |
|---|---|---|---|
| Csk Properties Ltd | -- | Service Title | |
| Csk Properties Ltd | -- | -- |
Source: Public Records
Mortgage History
| Date | Status | Borrower | Loan Amount |
|---|---|---|---|
| Open | Csk Properties Ltd | $60,173 |
Source: Public Records
Tax History Compared to Growth
Tax History
| Year | Tax Paid | Tax Assessment Tax Assessment Total Assessment is a certain percentage of the fair market value that is determined by local assessors to be the total taxable value of land and additions on the property. | Land | Improvement |
|---|---|---|---|---|
| 2025 | $2,429 | $143,658 | $30,000 | $113,658 |
| 2024 | $2,429 | $133,741 | $30,000 | $103,741 |
| 2023 | $2,334 | $125,572 | $13,440 | $112,132 |
| 2022 | $2,388 | $117,944 | $13,440 | $104,504 |
| 2021 | $2,233 | $104,283 | $13,440 | $90,843 |
| 2020 | $2,011 | $92,494 | $13,440 | $79,054 |
| 2019 | $2,123 | $94,575 | $13,440 | $81,135 |
| 2018 | $1,635 | $72,737 | $13,440 | $59,297 |
| 2017 | $1,432 | $63,612 | $13,440 | $50,172 |
| 2015 | $1,649 | $78,575 | $6,080 | $72,495 |
| 2014 | $1,649 | $74,182 | $6,080 | $68,102 |
Source: Public Records
Map
Nearby Homes