4401 Edison Rd Marsing, ID 83639
Estimated Value: $466,032 - $786,000
4
Beds
2
Baths
2,518
Sq Ft
$234/Sq Ft
Est. Value
About This Home
This home is located at 4401 Edison Rd, Marsing, ID 83639 and is currently estimated at $589,258, approximately $234 per square foot. 4401 Edison Rd is a home located in Owyhee County with nearby schools including Marsing Elementary School, Marsing Middle School, and Marsing High School.
Ownership History
Date
Name
Owned For
Owner Type
Purchase Details
Closed on
Jul 19, 2018
Sold by
Brasher Craig W
Bought by
Brasher Craig W and Brasher Rhonda R
Current Estimated Value
Home Financials for this Owner
Home Financials are based on the most recent Mortgage that was taken out on this home.
Original Mortgage
$95,000
Outstanding Balance
$82,000
Interest Rate
4.6%
Mortgage Type
Credit Line Revolving
Estimated Equity
$507,258
Purchase Details
Closed on
Feb 18, 2009
Sold by
Menchaca Molly L and Estate Of William Panzeri
Bought by
Brasher Craig W
Home Financials for this Owner
Home Financials are based on the most recent Mortgage that was taken out on this home.
Original Mortgage
$2,000,000
Interest Rate
4.92%
Mortgage Type
Purchase Money Mortgage
Create a Home Valuation Report for This Property
The Home Valuation Report is an in-depth analysis detailing your home's value as well as a comparison with similar homes in the area
Purchase History
| Date | Buyer | Sale Price | Title Company |
|---|---|---|---|
| Brasher Craig W | -- | Pioneer Title Co | |
| Brasher Craig W | -- | -- |
Source: Public Records
Mortgage History
| Date | Status | Borrower | Loan Amount |
|---|---|---|---|
| Open | Brasher Craig W | $95,000 | |
| Closed | Brasher Craig W | $2,000,000 |
Source: Public Records
Tax History
| Year | Tax Paid | Tax Assessment Tax Assessment Total Assessment is a certain percentage of the fair market value that is determined by local assessors to be the total taxable value of land and additions on the property. | Land | Improvement |
|---|---|---|---|---|
| 2025 | -- | $379,181 | $168,361 | $210,820 |
| 2024 | -- | $377,761 | $166,941 | $210,820 |
| 2023 | -- | $376,483 | $127,413 | $249,070 |
| 2022 | $1,693 | $388,873 | $127,413 | $261,460 |
| 2021 | $1,407 | $287,157 | $120,227 | $166,930 |
| 2020 | $1,155 | $232,526 | $85,758 | $146,768 |
| 2019 | $1,236 | $207,932 | $85,758 | $122,174 |
| 2018 | $1,253 | $201,660 | $71,465 | $130,195 |
| 2017 | $1,149 | $191,002 | $68,061 | $122,941 |
| 2016 | $841 | $148,248 | $61,968 | $86,280 |
| 2014 | $546 | $121,866 | $58,436 | $63,430 |
| 2011 | -- | $110,197 | $53,254 | $56,943 |
Source: Public Records
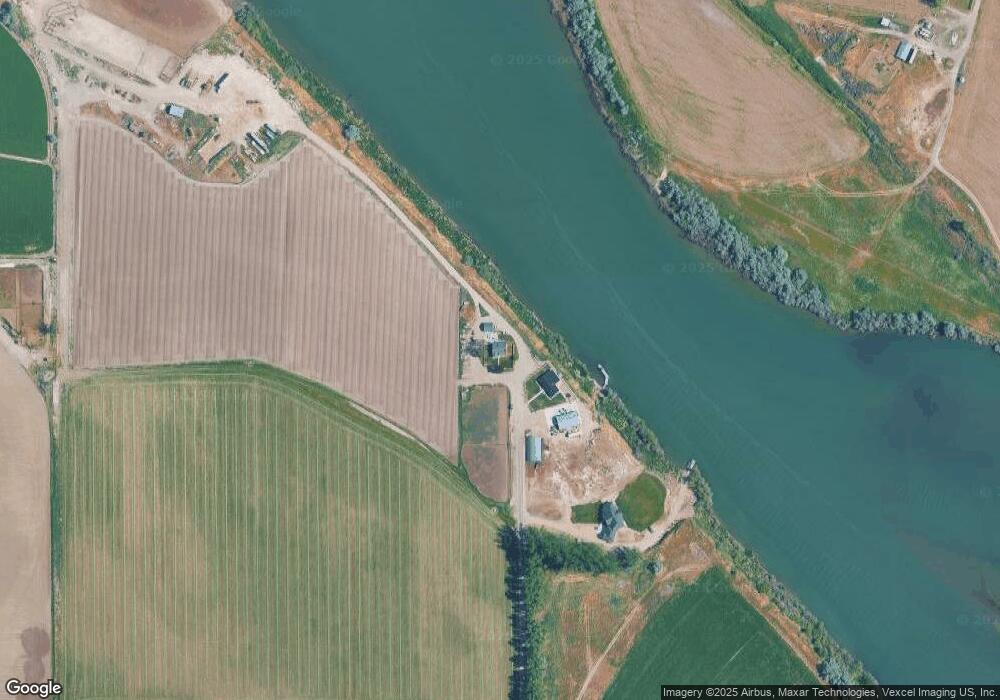
Map
Nearby Homes
- 20796 Lowell Rd
- TBD N Edison Rd
- TBD Lot 5 Cabernet Ln
- TBD Cabernet Ln - Lot 5 Parcel A
- 13628 Brunello Ct
- TBD Fran Ln
- 16125 Glenna Dr
- 16353 Brunello Ct
- 16362 Brunello Ct
- 16357 Brunello Ct
- 16368 Brunello Ct
- TBD N Bruneau Rd
- 20169 Hoskins Rd
- 6617 Red Rock Rd
- 604 Bobwhite
- 00 van Slyke Rd
- 15750 Park View Dr
- 0 Crystal Ln Unit 26560887
- 0 Crystal Ln Unit 26560888
- 000 Crystal Ln
- 4402 N Edison Rd
- 4430 N Edison Rd
- 21733 Apricot Ln
- 22180 Apricot Ln
- 22180 Apricot Ln
- 4322 Phipps Ln
- 15133 Lon Ln
- 4422 Phipps Ln
- 21598 Apricot Ln
- 4230 Phipps Ln
- 22418 Apricot Ln
- 22200 Papa Whiskey Ln
- 5838 Dunlap Rd
- 5719 Market Rd
- 6037 Dunlap Rd
- 6062 Dunlap Rd
- 4746 Edison Rd
- TBD Dunlap
- 5985 Dunlap Rd
- 5773 Dunlap Rd
Your Personal Tour Guide
Ask me questions while you tour the home.