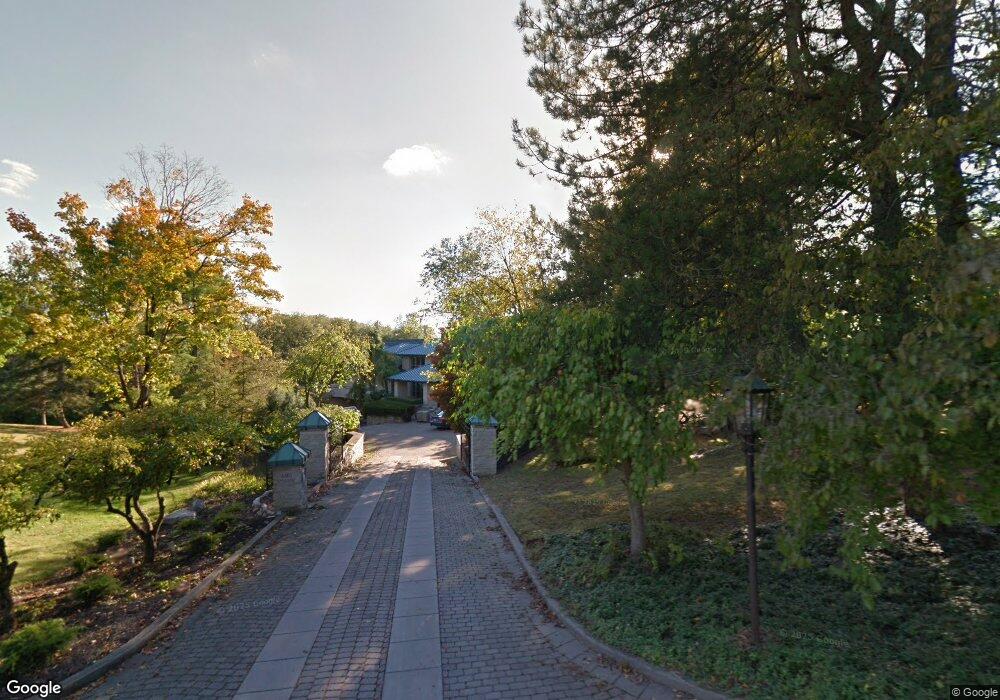
4401 Kipling Rd Columbus, OH 43220
Estimated Value: $2,080,335 - $3,721,000
5
Beds
11
Baths
9,979
Sq Ft
$288/Sq Ft
Est. Value
About This Home
This home is located at 4401 Kipling Rd, Columbus, OH 43220 and is currently estimated at $2,875,084, approximately $288 per square foot. 4401 Kipling Rd is a home located in Franklin County with nearby schools including Windermere Elementary School, Hastings Middle School, and Upper Arlington High School.
Ownership History
Date
Name
Owned For
Owner Type
Purchase Details
Closed on
Aug 23, 2021
Sold by
Edelman Barry D and Edelman Ellen J
Bought by
Jeon Seon and Lee Jungdeun
Current Estimated Value
Home Financials for this Owner
Home Financials are based on the most recent Mortgage that was taken out on this home.
Original Mortgage
$1,740,000
Outstanding Balance
$1,569,401
Interest Rate
2.8%
Mortgage Type
New Conventional
Estimated Equity
$1,305,683
Purchase Details
Closed on
Oct 20, 2006
Sold by
Liebert Robert A and Liebert Susan W
Bought by
Edelman Barry D and Edelman Ellen J
Purchase Details
Closed on
Nov 22, 1994
Sold by
Liebert Pamela J
Bought by
Ral Group Inc
Purchase Details
Closed on
Feb 1, 1990
Create a Home Valuation Report for This Property
The Home Valuation Report is an in-depth analysis detailing your home's value as well as a comparison with similar homes in the area
Home Values in the Area
Average Home Value in this Area
Purchase History
| Date | Buyer | Sale Price | Title Company |
|---|---|---|---|
| Jeon Seon | $2,400,000 | New Title Company Name | |
| Edelman Barry D | $1,550,000 | Title First | |
| Ral Group Inc | $1,750,000 | -- | |
| -- | -- | -- |
Source: Public Records
Mortgage History
| Date | Status | Borrower | Loan Amount |
|---|---|---|---|
| Open | Jeon Seon | $1,740,000 |
Source: Public Records
Tax History
| Year | Tax Paid | Tax Assessment Tax Assessment Total Assessment is a certain percentage of the fair market value that is determined by local assessors to be the total taxable value of land and additions on the property. | Land | Improvement |
|---|---|---|---|---|
| 2025 | $54,022 | $933,110 | $106,860 | $826,250 |
| 2024 | $54,022 | $933,110 | $106,860 | $826,250 |
| 2023 | $53,353 | $933,110 | $106,860 | $826,250 |
| 2022 | $50,106 | $708,480 | $71,230 | $637,250 |
| 2021 | $43,826 | $708,480 | $71,230 | $637,250 |
| 2020 | $43,438 | $708,480 | $71,230 | $637,250 |
| 2019 | $37,699 | $543,630 | $71,230 | $472,400 |
| 2018 | $37,654 | $543,630 | $71,230 | $472,400 |
| 2017 | $37,632 | $543,630 | $71,230 | $472,400 |
| 2016 | $37,855 | $572,430 | $87,570 | $484,860 |
| 2015 | $37,822 | $572,430 | $87,570 | $484,860 |
| 2014 | $37,864 | $572,430 | $87,570 | $484,860 |
| 2013 | $18,810 | $541,380 | $79,625 | $461,755 |
Source: Public Records
Map
Nearby Homes
- 2626 Chartwell Rd
- 2533 Middlesex Rd
- 2200 Nayland Rd
- 3900 Hillview Dr
- 2242 Atlee Ct Unit 5
- 4219 Bibury Ct
- 3055 Carriage Ln
- 2158 Sandston Rd
- 2668 Edgevale Rd
- 4025 Dublin Rd
- 2458 Edgevale Rd
- 5000 Slate Run Woods Ct
- 4325 Cameron Rd
- 2413 Edgevale Rd
- 4260 Darbyshire Ct
- 3827 Rockpointe Dr
- 3507 River Avon Cir
- 2480 Shrewsbury Rd
- 1916 Willoway Cir S
- 5233 Brandy Oaks Ln Unit 5233
- 4401 Kipling Ln
- 2626 Alliston Ct
- 4421 Kipling Rd
- 4362 Shelbourne Ln
- 4400 Kipling Rd
- 4355 Shelbourne Ln
- 2633 Alliston Ct
- 4420 Kipling Rd
- 4420 Kipling Ln
- 2634 Alliston Ct
- 4341 Shelbourne Ln
- 4356 Shelbourne Ln
- 2531 Wimbledon Rd
- 2641 Alliston Ct
- 4441 Kipling Rd
- 2590 Clairmont Ct
- 2525 Wimbledon Rd
- 2600 Clairmont Ct
- 4329 Shelbourne Ln
- 2646 Alliston Ct
Your Personal Tour Guide
Ask me questions while you tour the home.