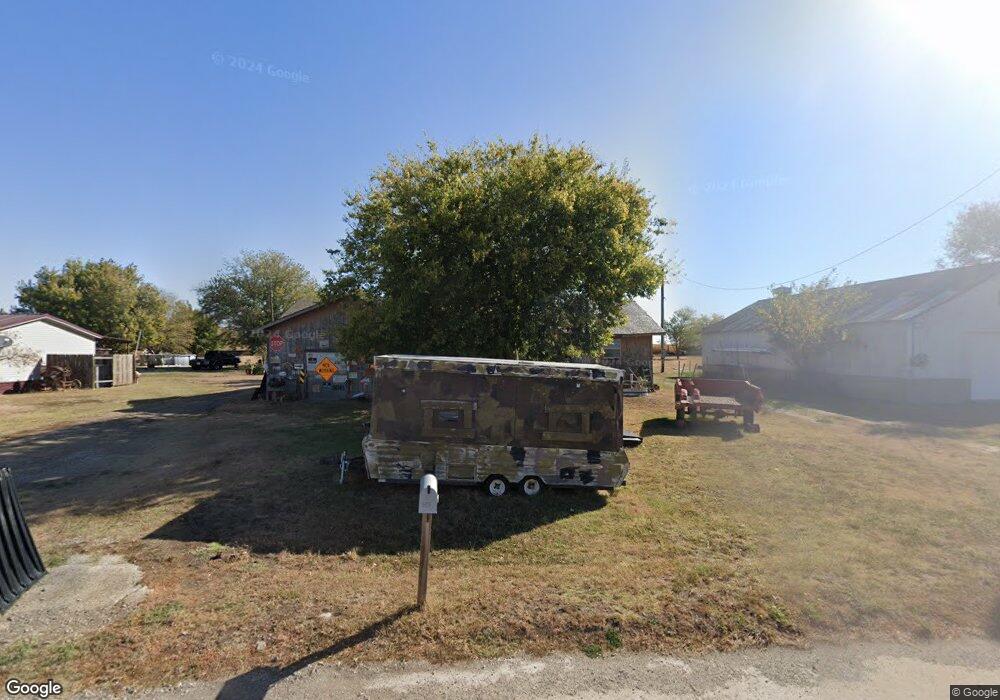
4401 N Pleasant View Rd Ponca City, OK 74601
Estimated Value: $86,847 - $117,000
2
Beds
1
Bath
1,016
Sq Ft
$99/Sq Ft
Est. Value
About This Home
This home is located at 4401 N Pleasant View Rd, Ponca City, OK 74601 and is currently estimated at $100,462, approximately $98 per square foot. 4401 N Pleasant View Rd is a home located in Kay County with nearby schools including Union Elementary School, Ponca City East Middle School, and Ponca City West Middle School.
Ownership History
Date
Name
Owned For
Owner Type
Purchase Details
Closed on
Dec 4, 2020
Sold by
Mauk David Lee
Bought by
Beathard Douglas and Beathard Dezri
Current Estimated Value
Home Financials for this Owner
Home Financials are based on the most recent Mortgage that was taken out on this home.
Original Mortgage
$73,709
Outstanding Balance
$65,740
Interest Rate
2.8%
Mortgage Type
Stand Alone Second
Estimated Equity
$34,722
Purchase Details
Closed on
Feb 18, 2020
Sold by
Montgomery Ashley
Bought by
Mauk David Lee
Purchase Details
Closed on
Apr 8, 2019
Sold by
Mauk David Cole
Bought by
Mauk David L and Montgomery Ashley Ray
Purchase Details
Closed on
Jan 3, 2018
Sold by
Mauk David L
Bought by
Mauk David Cole
Purchase Details
Closed on
Apr 13, 1994
Sold by
Spore Donald R and Spore Sarah E
Bought by
Mauk Donald L and Mauk Peggy D
Create a Home Valuation Report for This Property
The Home Valuation Report is an in-depth analysis detailing your home's value as well as a comparison with similar homes in the area
Home Values in the Area
Average Home Value in this Area
Purchase History
| Date | Buyer | Sale Price | Title Company |
|---|---|---|---|
| Beathard Douglas | $69,000 | None Available | |
| Mauk David Lee | -- | None Available | |
| Mauk David Lee | -- | None Available | |
| Mauk David L | -- | None Available | |
| Mauk David Cole | -- | None Available | |
| Mauk Donald L | $15,000 | -- |
Source: Public Records
Mortgage History
| Date | Status | Borrower | Loan Amount |
|---|---|---|---|
| Open | Beathard Douglas | $73,709 |
Source: Public Records
Tax History Compared to Growth
Tax History
| Year | Tax Paid | Tax Assessment Tax Assessment Total Assessment is a certain percentage of the fair market value that is determined by local assessors to be the total taxable value of land and additions on the property. | Land | Improvement |
|---|---|---|---|---|
| 2024 | $564 | $6,056 | $932 | $5,124 |
| 2023 | $564 | $7,590 | $932 | $6,658 |
| 2022 | $698 | $7,590 | $932 | $6,658 |
| 2021 | $700 | $7,590 | $932 | $6,658 |
| 2020 | $216 | $3,325 | $932 | $2,393 |
| 2019 | $298 | $3,185 | $932 | $2,253 |
| 2018 | $302 | $3,185 | $932 | $2,253 |
| 2017 | $299 | $3,185 | $932 | $2,253 |
| 2016 | $299 | $3,185 | $932 | $2,253 |
| 2015 | $298 | $3,162 | $932 | $2,230 |
| 2014 | $291 | $3,141 | $932 | $2,209 |
Source: Public Records
Map
Nearby Homes
- 3602 N 14th
- 2200 Chapel Hill Rd
- 1704 Fairway Place
- 3205 Kingston Rd
- 1413 Crawford Ave
- 3019 Meadow Ln
- 3013 Kingston Rd
- 0000 Hwy 77 Tr 1
- 0000 E Tower Rd
- 0000 E Tower Rd Tr 2
- 2602 Ridgecrest
- 0000 E Tower Rd Tr 3
- 2612 Meadow Ln
- TBD 5th and Windsor
- 2300 Glenmore Place
- Tr. 7, 4000 Blk E Hubbard Rd
- Tr. 6, 4000 Blk E Hubbard Rd
- Tr. 5, 4000 Blk E Hubbard Rd
- Tr. 4, 4000 Blk E Hubbard Rd
- Tr. 3, 4000 Blk E Hubbard Rd
- 4424 N Pleasant View Rd
- 4439 N Pleasant View Rd
- 4463 N Pleasant View Rd
- 4330 N Pleasant View Rd
- 4485 N Pleasant View Rd
- 4400 N Pleasant View Rd
- 4296 N Pleasant View Rd
- 4515 N Pleasant View Rd
- 4280 N Pleasant View Rd
- 4356 N Pleasant View Rd
- 4246 N Pleasant View Rd
- 4266 N Pleasant View Rd
- 4550 N Highway 77
- 4219 N Pleasant View Rd
- 1152 E Coleman Rd
- 3909 N Pleasant View Rd
- 915 E Hubbard Rd
- 0 N Hubbard Rd Unit 39725
- 0 N Hubbard Rd Unit 39724
- 0 N Hubbard Rd Unit 39726