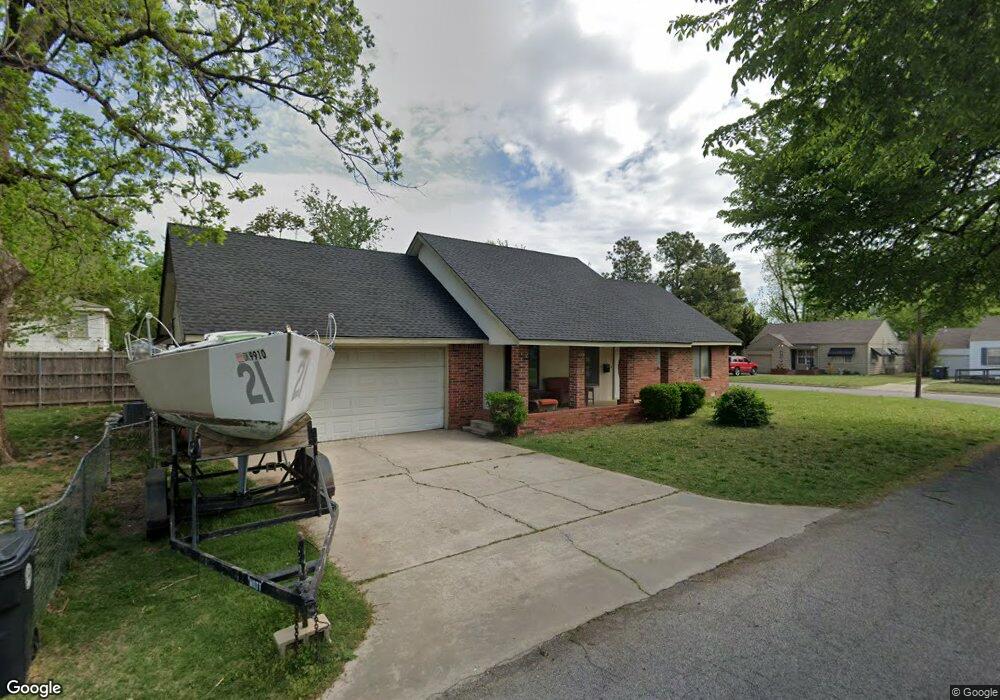
4401 N Redmond Ave Bethany, OK 73008
Estimated Value: $237,485 - $250,000
3
Beds
2
Baths
1,753
Sq Ft
$139/Sq Ft
Est. Value
About This Home
This home is located at 4401 N Redmond Ave, Bethany, OK 73008 and is currently estimated at $244,371, approximately $139 per square foot. 4401 N Redmond Ave is a home located in Oklahoma County with nearby schools including Earl Harris Elementary School, Bethany Middle School, and St Charles Borromeo Catholic School.
Ownership History
Date
Name
Owned For
Owner Type
Purchase Details
Closed on
Jun 18, 2021
Sold by
Ann Delong Carol
Bought by
Higginbotham Danielle C and Higginbotham Jacob M
Current Estimated Value
Home Financials for this Owner
Home Financials are based on the most recent Mortgage that was taken out on this home.
Original Mortgage
$190,000
Outstanding Balance
$172,021
Interest Rate
2.9%
Mortgage Type
New Conventional
Estimated Equity
$72,350
Purchase Details
Closed on
Jun 11, 2021
Sold by
Ann Delong Carol
Bought by
Higginbotham Danielle C and Higginbotham Jacob M
Home Financials for this Owner
Home Financials are based on the most recent Mortgage that was taken out on this home.
Original Mortgage
$190,000
Outstanding Balance
$172,021
Interest Rate
2.9%
Mortgage Type
New Conventional
Estimated Equity
$72,350
Purchase Details
Closed on
Sep 13, 2005
Sold by
Delong David Bryan
Bought by
Delong Carol Ann
Create a Home Valuation Report for This Property
The Home Valuation Report is an in-depth analysis detailing your home's value as well as a comparison with similar homes in the area
Home Values in the Area
Average Home Value in this Area
Purchase History
| Date | Buyer | Sale Price | Title Company |
|---|---|---|---|
| Higginbotham Danielle C | $200,000 | Chicago Title | |
| Higginbotham Danielle C | $200,000 | Chicago Title | |
| Delong Carol Ann | -- | None Available |
Source: Public Records
Mortgage History
| Date | Status | Borrower | Loan Amount |
|---|---|---|---|
| Open | Higginbotham Danielle C | $190,000 | |
| Closed | Higginbotham Danielle C | $190,000 |
Source: Public Records
Tax History Compared to Growth
Tax History
| Year | Tax Paid | Tax Assessment Tax Assessment Total Assessment is a certain percentage of the fair market value that is determined by local assessors to be the total taxable value of land and additions on the property. | Land | Improvement |
|---|---|---|---|---|
| 2024 | $3,147 | $24,255 | $4,645 | $19,610 |
| 2023 | $3,147 | $23,100 | $4,402 | $18,698 |
| 2022 | $2,640 | $22,000 | $4,768 | $17,232 |
| 2021 | $2,225 | $19,599 | $4,460 | $15,139 |
| 2020 | $2,303 | $19,029 | $4,241 | $14,788 |
| 2019 | $2,125 | $18,475 | $2,518 | $15,957 |
| 2018 | $2,074 | $17,937 | $0 | $0 |
| 2017 | $2,051 | $17,414 | $2,502 | $14,912 |
| 2016 | $2,005 | $16,907 | $2,479 | $14,428 |
| 2015 | $1,841 | $16,414 | $2,301 | $14,113 |
| 2014 | $1,775 | $15,936 | $2,259 | $13,677 |
Source: Public Records
Map
Nearby Homes
- 4400 N Wheeler Ave
- 4507 N Donald Ave
- 4604 N Donald Ave
- 4508 N College Ave
- 6019 NW 47th St
- 6101 NW 48th St
- 6112 NW 49th St
- 6802 NW 45th St
- 6024 NW 50th St
- 4908 N Central Rd
- 4808 N Willow Ave
- 3817 N Asbury Ave
- 3720 N Peniel Ave
- 5905 NW 50th St
- 7014 NW 44th St
- 5712 NW 42nd St
- 6031 NW 53rd Terrace
- 4601 N Rockwell Ave
- 6203 NW 53rd St Unit 48
- 6800 NW 36th St
- 4403 N Redmond Ave
- 4309 N Redmond Ave
- 4405 N Redmond Ave
- 4400 N Donald Ave
- 4402 N Donald Ave
- 4305 N Redmond Ave
- 4400 N Redmond Ave
- 4312 N Redmond Ave
- 4407 N Redmond Ave
- 4404 N Donald Ave
- 4402 N Redmond Ave
- 4310 N Donald Ave
- 4310 N Redmond Ave
- 4409 N Redmond Ave
- 4404 N Redmond Ave
- 4406 N Donald Ave
- 4306 N Donald Ave
- 4408 N Redmond Ave
- 4408 N Donald Ave
- 4304 N Redmond Ave