J
Seller's Agent in 2025
Jessica McCune
Berkshire Hathaway Professional Realty
(937) 510-4081
9 in this area
14 Total Sales


Estimated Value: $204,000 - $221,000
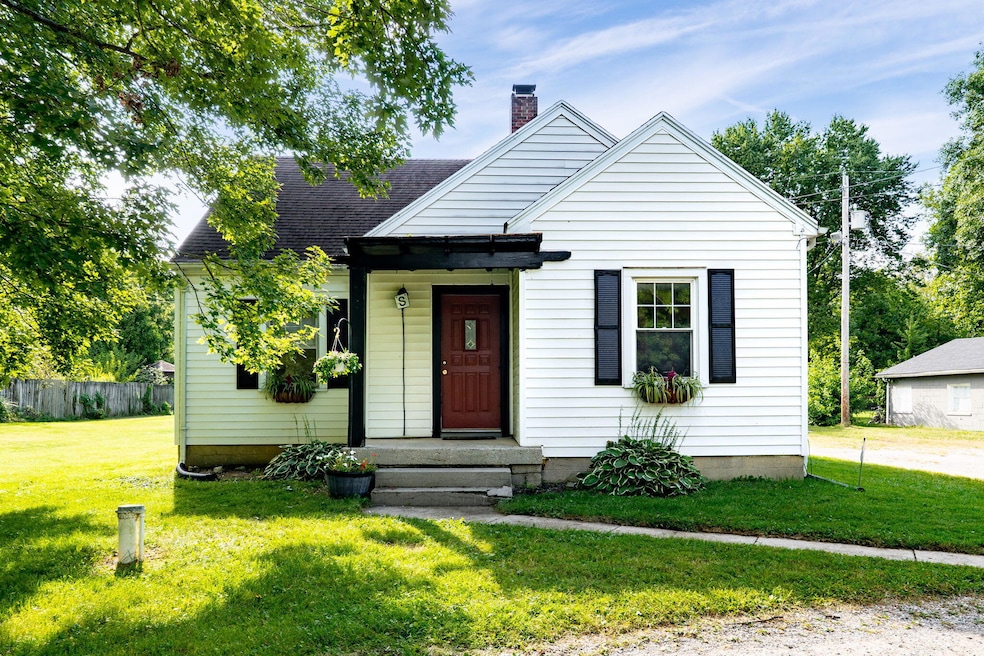
Spacious 4-bedroom, 2-bath home situated on a full acre! This property features a rare 6-car garage--perfect for car enthusiasts, storage, or hobbies. A two-entrance driveway makes access convenient and practical. Inside, you'll find generous living space and plenty of natural light throughout. Located just minutes from Rocky Lakes Golf Course and Young's Jersey Dairy, this home offers the perfect balance of quiet living with easy access to local favorites.FIREPLACE IS NOT WARRANTEDShowings can only be made for Friday and Saturdays after 11am, All showings to be made through showing time.
Last Agent to Sell the Property
Berkshire Hathaway Professional Realty License #2024005589 Listed on: 08/29/2025

We collect this data history from publicly available records. To have your information removed, we recommend requesting removal directly through your county’s website.
| Date | Buyer | Sale Price | Title Company |
|---|---|---|---|
| Stitzel Gary William | $199,000 | Team Title & Closing Services | |
| Simison Christopher | $153,000 | Landmark Title Agency South | |
| Adams Raymond P | $108,000 | None Available | |
| Folck Freddy Gene | $45,000 | -- |
We collect this data history from publicly available records. To have your information removed, we recommend requesting removal directly through your county’s website.
| Date | Status | Borrower | Loan Amount |
|---|---|---|---|
| Open | Stitzel Gary William | $169,150 | |
| Previous Owner | Simison Christopher | $153,900 | |
| Previous Owner | Adams Raymond P | $110,204 |
| Date | Event | Price | List to Sale | Price per Sq Ft |
|---|---|---|---|---|
| 10/08/2025 10/08/25 | Sold | $199,000 | -0.5% | $131 / Sq Ft |
| 09/10/2025 09/10/25 | Pending | -- | -- | -- |
| 09/03/2025 09/03/25 | For Sale | $199,900 | 0.0% | $132 / Sq Ft |
| 08/30/2025 08/30/25 | Pending | -- | -- | -- |
| 08/29/2025 08/29/25 | For Sale | $199,900 | -- | $132 / Sq Ft |
| Year | Tax Paid | Tax Assessment Tax Assessment Total Assessment is a certain percentage of the fair market value that is determined by local assessors to be the total taxable value of land and additions on the property. | Land | Improvement |
|---|---|---|---|---|
| 2025 | $3,141 | $58,310 | $13,740 | $44,570 |
| 2024 | $3,071 | $55,400 | $13,480 | $41,920 |
| 2023 | $3,071 | $55,400 | $13,480 | $41,920 |
| 2022 | $3,069 | $55,400 | $13,480 | $41,920 |
| 2021 | $2,391 | $38,070 | $9,630 | $28,440 |
| 2020 | $2,331 | $38,070 | $9,630 | $28,440 |
| 2019 | $2,350 | $38,070 | $9,630 | $28,440 |
| 2018 | $2,467 | $39,490 | $8,750 | $30,740 |
| 2017 | $2,472 | $34,563 | $8,750 | $25,813 |
| 2016 | $2,193 | $34,563 | $8,750 | $25,813 |
| 2015 | $1,919 | $34,563 | $8,750 | $25,813 |
| 2014 | $1,873 | $34,563 | $8,750 | $25,813 |
| 2013 | $1,704 | $34,563 | $8,750 | $25,813 |
J
Seller's Agent in 2025
Jessica McCune
Berkshire Hathaway Professional Realty
(937) 510-4081
9 in this area
14 Total Sales
Buyer's Agent in 2025
Chelsea Ragon
Coldwell Banker Heritage
(937) 561-5019
32 in this area
165 Total Sales
Source: Western Regional Information Systems & Technology (WRIST)
MLS Number: 1041036
APN: 10-01100-01220-2021
Disclaimer: Certain information contained herein is derived from information provided by parties other than Homes.com. All information provided is deemed reliable, but is not guaranteed to be accurate and should be independently verified.
![]() IDX information is provided exclusively for personal, non-commercial use, and may not be used for any purpose other than to identify prospective properties consumers may be interested in purchasing.
IDX information is provided exclusively for personal, non-commercial use, and may not be used for any purpose other than to identify prospective properties consumers may be interested in purchasing.
Ask me questions while you tour the home.