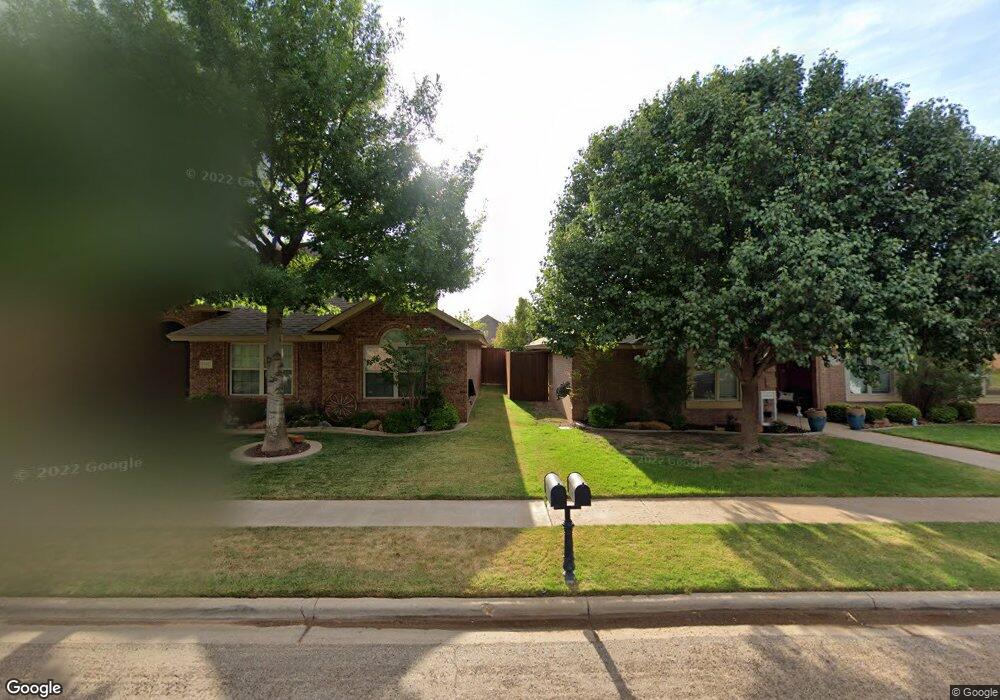
4402 108th St Unit 2 Lubbock, TX 79424
Estimated Value: $280,919 - $319,000
2
Beds
2
Baths
1,797
Sq Ft
$169/Sq Ft
Est. Value
About This Home
This home is located at 4402 108th St Unit 2, Lubbock, TX 79424 and is currently estimated at $304,480, approximately $169 per square foot. 4402 108th St Unit 2 is a home located in Lubbock County with nearby schools including Lubbock-Cooper Central Elementary School, Laura Bush Middle School, and Lubbock-Cooper Liberty High School.
Ownership History
Date
Name
Owned For
Owner Type
Purchase Details
Closed on
Mar 4, 2019
Sold by
Dawson Mickey W and Dawson Mary E
Bought by
Parkinson Sharran F
Current Estimated Value
Home Financials for this Owner
Home Financials are based on the most recent Mortgage that was taken out on this home.
Original Mortgage
$142,000
Outstanding Balance
$124,842
Interest Rate
4.4%
Mortgage Type
Purchase Money Mortgage
Estimated Equity
$179,638
Purchase Details
Closed on
Aug 4, 2008
Sold by
Dawson Mickey W and Dawson Mary E
Bought by
Dawson Mickey W and Dawson Mary E
Purchase Details
Closed on
Dec 22, 2007
Sold by
Dawson Mickey and Dawson Mary
Bought by
Dawson Mickey W and Dawson Mary E
Purchase Details
Closed on
May 9, 2005
Sold by
Terrasue Inc Dba
Bought by
Dawson Mickey W and Dawson Mary E
Create a Home Valuation Report for This Property
The Home Valuation Report is an in-depth analysis detailing your home's value as well as a comparison with similar homes in the area
Home Values in the Area
Average Home Value in this Area
Purchase History
| Date | Buyer | Sale Price | Title Company |
|---|---|---|---|
| Parkinson Sharran F | -- | Service Title | |
| Dawson Mickey W | -- | Transcontinental Title Co | |
| Dawson Mickey W | -- | None Available | |
| Dawson Mickey W | -- | -- |
Source: Public Records
Mortgage History
| Date | Status | Borrower | Loan Amount |
|---|---|---|---|
| Open | Parkinson Sharran F | $142,000 |
Source: Public Records
Tax History Compared to Growth
Tax History
| Year | Tax Paid | Tax Assessment Tax Assessment Total Assessment is a certain percentage of the fair market value that is determined by local assessors to be the total taxable value of land and additions on the property. | Land | Improvement |
|---|---|---|---|---|
| 2025 | $2,028 | $283,519 | $20,000 | $263,519 |
| 2024 | $2,028 | $278,475 | $20,000 | $258,475 |
| 2023 | $5,367 | $255,075 | $20,000 | $235,075 |
| 2022 | $5,303 | $231,886 | $20,000 | $211,886 |
| 2021 | $5,286 | $219,992 | $20,000 | $199,992 |
| 2020 | $5,212 | $210,200 | $20,000 | $190,200 |
| 2019 | $5,120 | $200,776 | $20,000 | $180,776 |
| 2018 | $4,895 | $191,744 | $20,000 | $171,744 |
| 2017 | $5,020 | $196,434 | $20,000 | $176,434 |
| 2016 | $5,072 | $198,439 | $20,000 | $178,439 |
| 2015 | $4,504 | $189,337 | $20,000 | $169,337 |
| 2014 | $4,504 | $178,129 | $20,000 | $158,129 |
Source: Public Records
Map
Nearby Homes
- 4402 108th St Unit 19
- 4415 108th St
- 4423 106th St
- 4009 109th St
- 10606 Salem Ave
- 11001 Richmond Ave
- 3911 109th St
- 4712 109th St
- 4509 103rd St
- 10202 Peoria Ave
- 10110 Peoria Ave
- 3913 106th St
- 4701 104th St
- 4704 105th St
- 4007 113th St
- 10501 Troy Ave
- 4712 105th St
- 4802 105th St
- 10301 Norfolk Ave
- 4602 101st St
- 4402 108th St Unit 11
- 4402 108th St Unit 10
- 4402 108th St Unit 9
- 4402 108th St Unit 8
- 4402 108th St Unit 7
- 4402 108th St Unit 6
- 4402 108th St Unit 5
- 4402 108th St Unit 4
- 4402 108th St Unit 3
- 4402 108th St Unit 1
- 4402 108th St Unit 24
- 4402 108th St Unit 22
- 4402 108th St Unit 21
- 4402 108th St Unit 20
- 4402 108th St Unit 18
- 4402 108th St Unit 17
- 4402 108th St Unit 16
- 4402 108th St Unit 15
- 4402 108th St Unit 14
- 4402 108th St Unit 13