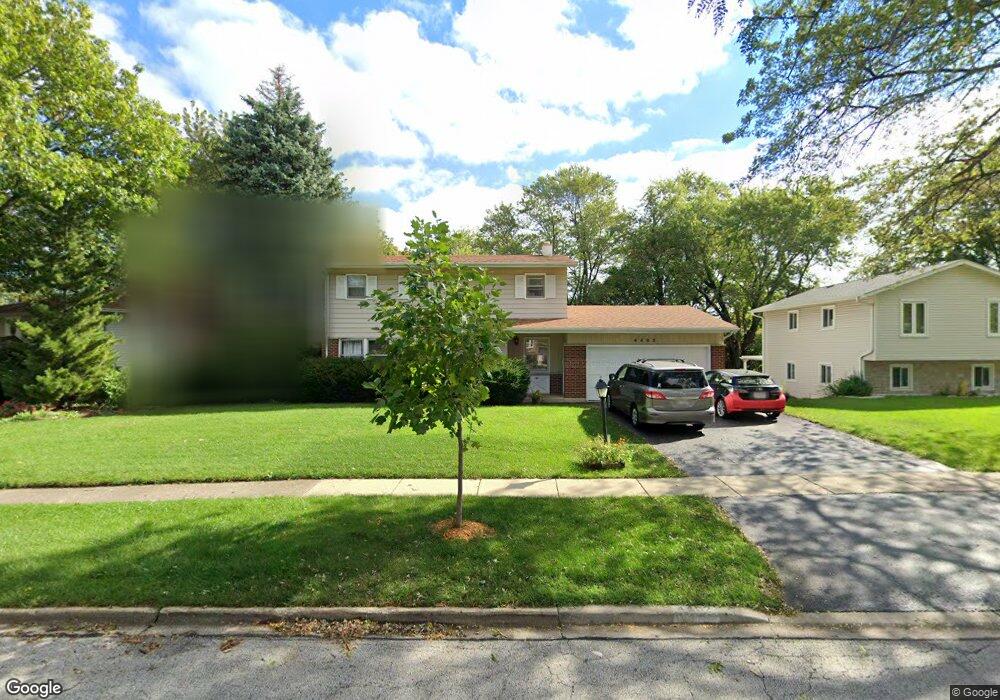
4402 Hawthorn Ln Rolling Meadows, IL 60008
Busse Woods NeighborhoodEstimated Value: $440,685 - $499,000
4
Beds
3
Baths
1,923
Sq Ft
$243/Sq Ft
Est. Value
About This Home
This home is located at 4402 Hawthorn Ln, Rolling Meadows, IL 60008 and is currently estimated at $466,921, approximately $242 per square foot. 4402 Hawthorn Ln is a home located in Cook County with nearby schools including Willow Bend Elementary School, Carl Sandburg Junior High School, and Rolling Meadows High School.
Ownership History
Date
Name
Owned For
Owner Type
Purchase Details
Closed on
Dec 14, 2007
Sold by
Lee Edward R and Burdi David J
Bought by
Griffiths James J and Griffiths Jessica
Current Estimated Value
Home Financials for this Owner
Home Financials are based on the most recent Mortgage that was taken out on this home.
Original Mortgage
$388,550
Outstanding Balance
$242,194
Interest Rate
6.27%
Mortgage Type
Unknown
Estimated Equity
$224,727
Purchase Details
Closed on
Oct 27, 2005
Sold by
Claney Flossie P
Bought by
Burdi David J and Lee Edward R
Home Financials for this Owner
Home Financials are based on the most recent Mortgage that was taken out on this home.
Original Mortgage
$258,000
Interest Rate
6.26%
Mortgage Type
Negative Amortization
Purchase Details
Closed on
Dec 1, 1999
Sold by
Claney Flossie P
Bought by
Claney Flossie P and Claney Trust
Purchase Details
Closed on
Jul 30, 1996
Sold by
First Bank National Assn Of Des Plaines
Bought by
Claney Flossie P
Create a Home Valuation Report for This Property
The Home Valuation Report is an in-depth analysis detailing your home's value as well as a comparison with similar homes in the area
Home Values in the Area
Average Home Value in this Area
Purchase History
| Date | Buyer | Sale Price | Title Company |
|---|---|---|---|
| Griffiths James J | $409,000 | Attorneys Title Guaranty Fun | |
| Burdi David J | $322,500 | Chicago Title Insurance Comp | |
| Claney Flossie P | -- | -- | |
| Claney Flossie P | -- | -- |
Source: Public Records
Mortgage History
| Date | Status | Borrower | Loan Amount |
|---|---|---|---|
| Open | Griffiths James J | $388,550 | |
| Previous Owner | Burdi David J | $258,000 |
Source: Public Records
Tax History
| Year | Tax Paid | Tax Assessment Tax Assessment Total Assessment is a certain percentage of the fair market value that is determined by local assessors to be the total taxable value of land and additions on the property. | Land | Improvement |
|---|---|---|---|---|
| 2025 | $9,065 | $43,000 | $9,512 | $33,488 |
| 2024 | $9,065 | $33,319 | $8,010 | $25,309 |
| 2023 | $8,643 | $33,319 | $8,010 | $25,309 |
| 2022 | $8,643 | $33,319 | $8,010 | $25,309 |
| 2021 | $7,745 | $26,842 | $5,256 | $21,586 |
| 2020 | $7,636 | $26,842 | $5,256 | $21,586 |
| 2019 | $7,735 | $30,160 | $5,256 | $24,904 |
| 2018 | $8,698 | $30,414 | $4,505 | $25,909 |
| 2017 | $8,540 | $30,414 | $4,505 | $25,909 |
| 2016 | $8,213 | $30,414 | $4,505 | $25,909 |
| 2015 | $8,060 | $28,352 | $4,005 | $24,347 |
| 2014 | $7,885 | $28,352 | $4,005 | $24,347 |
| 2013 | $7,678 | $28,352 | $4,005 | $24,347 |
Source: Public Records
Map
Nearby Homes
- 399 Knollwood Ct
- 1813 Hemlock Place Unit 311
- 5001 Carriageway Dr Unit 215
- 3200 Thrush Ln
- 1931 Prairie Square Unit 1931
- 1912 Prairie Square Unit 309
- 3710 Meadow Dr
- 5000 Carriageway Dr Unit 305
- 5000 Carriageway Dr Unit 315
- 1926 Prairie Square Unit 210
- 3712 Jay Ln
- 4980 Kimball Hill Dr Unit C2
- 2504 Algonquin Rd Unit 14
- 2402 Algonquin Rd Unit 9
- 2302 Fulle St
- 3345 Kirchoff Rd Unit 5C
- 3135 Town Square Dr Unit 401
- 3135 Town Square Dr Unit 104
- 3 Holyoke on Auburn
- 3265 Kirchoff Rd Unit 116
- 4402 Hawthorne Ln
- 4400 Hawthorn Ln
- 4404 Hawthorn Ln
- 4310 Hawthorn Ln
- 4406 Hawthorn Ln
- 4405 Sycamore Ln
- 4403 Hawthorn Ln
- 4407 Sycamore Ln
- 4403 Sycamore Ln
- 4405 Hawthorn Ln
- 3605 Brookmeade Dr
- 4401 Hawthorn Ln
- 4315 Hawthorne Ln
- 3607 Brookmeade Dr
- 4311 Hawthorn Ln
- 4315 Hawthorn Ln
- 4409 Sycamore Ln
- 4401 Sycamore Ln
- 4310 E Frontage Rd
- 4309 Hawthorn Ln
Your Personal Tour Guide
Ask me questions while you tour the home.