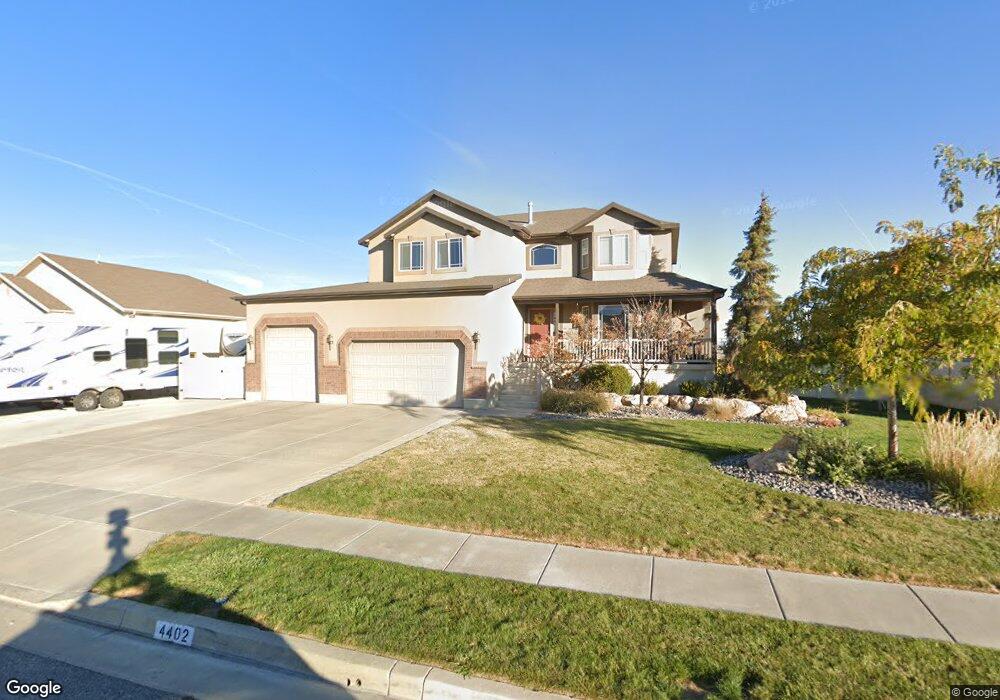
4402 W 625 S Clearfield, UT 84015
Estimated Value: $643,022 - $742,000
4
Beds
3
Baths
2,250
Sq Ft
$301/Sq Ft
Est. Value
About This Home
This home is located at 4402 W 625 S, Clearfield, UT 84015 and is currently estimated at $678,256, approximately $301 per square foot. 4402 W 625 S is a home located in Davis County with nearby schools including West Point School, West Point Junior High School, and Syracuse High School.
Ownership History
Date
Name
Owned For
Owner Type
Purchase Details
Closed on
Dec 19, 2006
Sold by
Mike Schultz Construction Inc
Bought by
Wall Jason C and Wall Emily
Current Estimated Value
Home Financials for this Owner
Home Financials are based on the most recent Mortgage that was taken out on this home.
Original Mortgage
$261,405
Outstanding Balance
$215,287
Interest Rate
7%
Mortgage Type
New Conventional
Estimated Equity
$462,969
Purchase Details
Closed on
Sep 28, 2005
Sold by
Yeates Jared F and Yeates Kimberly W
Bought by
Stephensen Daniel R and Stephensen Elizabeth D
Home Financials for this Owner
Home Financials are based on the most recent Mortgage that was taken out on this home.
Original Mortgage
$909,225
Interest Rate
5.7%
Mortgage Type
Purchase Money Mortgage
Create a Home Valuation Report for This Property
The Home Valuation Report is an in-depth analysis detailing your home's value as well as a comparison with similar homes in the area
Home Values in the Area
Average Home Value in this Area
Purchase History
| Date | Buyer | Sale Price | Title Company |
|---|---|---|---|
| Wall Jason C | -- | Heritage West Title Ins Agen | |
| Stephensen Daniel R | -- | Founders Title Co |
Source: Public Records
Mortgage History
| Date | Status | Borrower | Loan Amount |
|---|---|---|---|
| Open | Wall Jason C | $261,405 | |
| Previous Owner | Stephensen Daniel R | $909,225 |
Source: Public Records
Tax History
| Year | Tax Paid | Tax Assessment Tax Assessment Total Assessment is a certain percentage of the fair market value that is determined by local assessors to be the total taxable value of land and additions on the property. | Land | Improvement |
|---|---|---|---|---|
| 2025 | $3,562 | $327,800 | $112,687 | $215,113 |
| 2024 | $3,404 | $314,600 | $101,452 | $213,148 |
| 2023 | $3,272 | $556,000 | $126,380 | $429,620 |
| 2022 | $3,481 | $323,950 | $65,716 | $258,234 |
| 2021 | $3,206 | $446,000 | $102,765 | $343,235 |
| 2020 | $2,825 | $387,000 | $86,316 | $300,684 |
| 2019 | $2,771 | $374,000 | $83,748 | $290,252 |
| 2018 | $2,611 | $347,000 | $83,784 | $263,216 |
| 2016 | $2,332 | $162,580 | $32,416 | $130,164 |
| 2015 | $2,420 | $159,885 | $32,416 | $127,469 |
| 2014 | $2,094 | $139,992 | $32,416 | $107,576 |
| 2013 | -- | $118,621 | $29,346 | $89,275 |
Source: Public Records
Map
Nearby Homes
- 696 S 4500 W
- 396 S 4300 W
- 388 S 4300 W Unit 607
- 372 S 4300 W Unit 609
- 364 S 4300 W Unit 610
- 356 S 4300 W Unit 611
- 387 S 4250 W
- 4260 W 350 S
- 4411 W 920 S Unit 111
- 964 S 4475 W Unit 123
- 982 S 4475 W Unit 122
- 1007 S 4200 W
- 1126 S 4475 W
- 1139 S 4475 W
- 4662 W 1100 S
- 1144 S 4475 W
- 1157 S 4425 W
- 1155 S 4475 W
- 4578 W 1150 S
- 3971 W 975 S
Your Personal Tour Guide
Ask me questions while you tour the home.