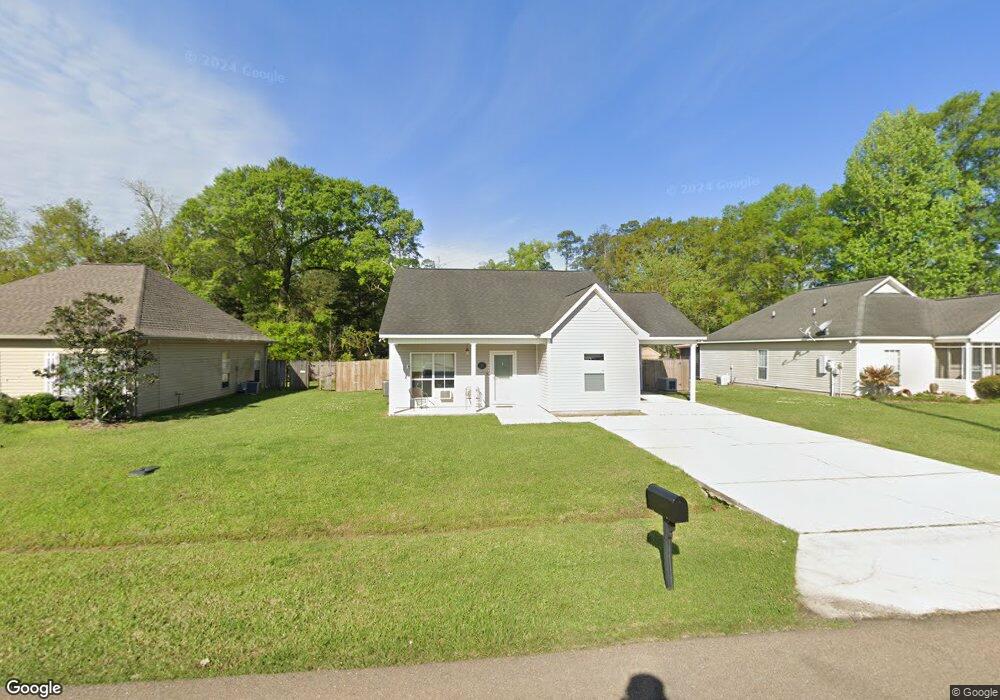
44027 Sweet William Dr Hammond, LA 70403
Estimated Value: $167,778 - $198,000
3
Beds
2
Baths
1,206
Sq Ft
$149/Sq Ft
Est. Value
About This Home
This home is located at 44027 Sweet William Dr, Hammond, LA 70403 and is currently estimated at $180,195, approximately $149 per square foot. 44027 Sweet William Dr is a home located in Tangipahoa Parish with nearby schools including Hammond Eastside Magnet, Hammond High Magnet School, and Tangi Academy.
Ownership History
Date
Name
Owned For
Owner Type
Purchase Details
Closed on
May 10, 2012
Sold by
Wells Fargo Bank
Bought by
Vice Darren J and Vice Angelle L
Current Estimated Value
Home Financials for this Owner
Home Financials are based on the most recent Mortgage that was taken out on this home.
Original Mortgage
$107,040
Outstanding Balance
$74,163
Interest Rate
3.9%
Mortgage Type
New Conventional
Estimated Equity
$106,032
Purchase Details
Closed on
Aug 24, 2006
Sold by
Welch Development Llc
Bought by
Jackson Ashley Perkins and Jackson Reggie
Home Financials for this Owner
Home Financials are based on the most recent Mortgage that was taken out on this home.
Original Mortgage
$135,000
Interest Rate
8.69%
Mortgage Type
Adjustable Rate Mortgage/ARM
Purchase Details
Closed on
Mar 9, 2006
Sold by
Trufant Aurora Gurly Maurin
Bought by
Welch Developments Llc
Create a Home Valuation Report for This Property
The Home Valuation Report is an in-depth analysis detailing your home's value as well as a comparison with similar homes in the area
Home Values in the Area
Average Home Value in this Area
Purchase History
| Date | Buyer | Sale Price | Title Company |
|---|---|---|---|
| Vice Darren J | $104,900 | Accent Title | |
| Jackson Ashley Perkins | $135,000 | Title Source Of La | |
| Welch Developments Llc | $19,000 | Hammond Title Co Inc |
Source: Public Records
Mortgage History
| Date | Status | Borrower | Loan Amount |
|---|---|---|---|
| Open | Vice Darren J | $107,040 | |
| Previous Owner | Jackson Ashley Perkins | $135,000 |
Source: Public Records
Tax History Compared to Growth
Tax History
| Year | Tax Paid | Tax Assessment Tax Assessment Total Assessment is a certain percentage of the fair market value that is determined by local assessors to be the total taxable value of land and additions on the property. | Land | Improvement |
|---|---|---|---|---|
| 2024 | $1,051 | $8,737 | $1,814 | $6,923 |
| 2023 | $1,050 | $8,673 | $1,680 | $6,993 |
| 2022 | $1,050 | $8,673 | $1,680 | $6,993 |
| 2021 | $148 | $8,673 | $1,680 | $6,993 |
| 2020 | $1,050 | $8,673 | $1,680 | $6,993 |
| 2019 | $1,014 | $8,461 | $1,680 | $6,781 |
| 2018 | $1,016 | $8,461 | $1,680 | $6,781 |
| 2017 | $1,025 | $8,461 | $1,680 | $6,781 |
| 2016 | $1,016 | $8,461 | $1,680 | $6,781 |
| 2015 | $142 | $8,673 | $1,680 | $6,993 |
| 2014 | $136 | $8,673 | $1,680 | $6,993 |
Source: Public Records
Map
Nearby Homes
- 44035 Sweet William Dr
- 44111 Covington Ridge Dr
- 17310 Paddock Cir
- 17314 Paddock Cir
- 17252 English Saddle Ln
- 17351 Old Covington Hwy
- 17198 Bridle Path
- 17198 Bridle Path None
- 44083 High Oats Trail
- 44154 Simpson Place
- 43484 Springwood Way
- 17253 Churchill Dr
- 0 Simpson Place
- 43448 Springwood Way
- 43480 N Little Italy Rd
- 44018 Easy St
- 44299 Country Creek Ln Unit 10
- 44299 Country Creek Ln Unit LOT 8
- 43485 Mclain Ln
- 44019 Sweet William Dr
- 44041 Sweet William Dr
- 44015 Sweet William Dr
- 44026 Sweet William Dr
- 44020 Sweet William Dr
- 44034 Sweet William Dr
- 44014 Sweet William Dr
- 44049 Sweet William Dr
- 44049 Sweet William Dr Unit A
- 44011 Sweet William Dr
- 44040 Sweet William Dr
- 44010 Sweet William Dr
- 44048 Sweet William Dr
- 44007 Sweet William Dr
- 44055 Sweet William Dr
- 44095 Covington Ridge Dr
- 44101 Covington Ridge
- 44095 Covington Ridge
- 44091 Covington Ridge
- 44085 Covington Ridge