4403 28th St Lubbock, TX 79410
Coronado NeighborhoodEstimated Value: $233,000 - $254,383
3
Beds
2
Baths
2,159
Sq Ft
$111/Sq Ft
Est. Value
About This Home
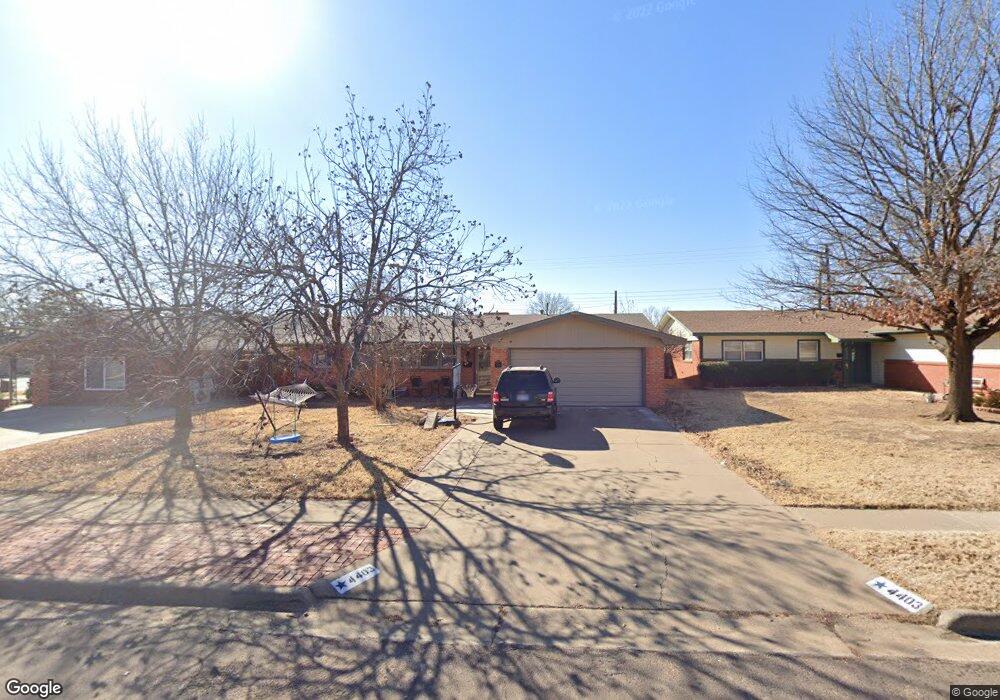
This home is located at 4403 28th St, Lubbock, TX 79410 and is currently estimated at $239,096, approximately $110 per square foot. 4403 28th St is a home located in Lubbock County with nearby schools including Overton Elementary School, Commander William C. McCool Academy, and Mackenzie Middle School.
Ownership History
Date
Name
Owned For
Owner Type
Purchase Details
Closed on
Oct 30, 2024
Sold by
Trevino Vanessa Nichole and Gonzalez Vanessa N
Bought by
Gonzalez Alberto G
Current Estimated Value
Home Financials for this Owner
Home Financials are based on the most recent Mortgage that was taken out on this home.
Original Mortgage
$110,750
Outstanding Balance
$109,579
Interest Rate
6.32%
Mortgage Type
Credit Line Revolving
Estimated Equity
$129,517
Purchase Details
Closed on
Apr 29, 2010
Sold by
Barron Dixie Ann Finch
Bought by
Gonzales Alberto G and Trevino Vanessa Nichole
Home Financials for this Owner
Home Financials are based on the most recent Mortgage that was taken out on this home.
Original Mortgage
$122,735
Interest Rate
5.25%
Mortgage Type
FHA
Purchase Details
Closed on
Jul 11, 2007
Sold by
Barron Alton N
Bought by
Gonzales Alberto G
Create a Home Valuation Report for This Property
The Home Valuation Report is an in-depth analysis detailing your home's value as well as a comparison with similar homes in the area
Home Values in the Area
Average Home Value in this Area
Purchase History
| Date | Buyer | Sale Price | Title Company |
|---|---|---|---|
| Gonzalez Alberto G | -- | None Listed On Document | |
| Gonzales Alberto G | -- | Service Title | |
| Gonzales Alberto G | -- | -- |
Source: Public Records
Mortgage History
| Date | Status | Borrower | Loan Amount |
|---|---|---|---|
| Open | Gonzalez Alberto G | $110,750 | |
| Previous Owner | Gonzales Alberto G | $122,735 |
Source: Public Records
Tax History Compared to Growth
Tax History
| Year | Tax Paid | Tax Assessment Tax Assessment Total Assessment is a certain percentage of the fair market value that is determined by local assessors to be the total taxable value of land and additions on the property. | Land | Improvement |
|---|---|---|---|---|
| 2025 | $3,230 | $219,390 | $30,000 | $189,390 |
| 2024 | $3,230 | $202,866 | $30,000 | $172,866 |
| 2023 | $3,442 | $185,166 | $13,125 | $172,041 |
| 2022 | $3,408 | $168,333 | $13,125 | $174,137 |
| 2021 | $3,277 | $153,030 | $13,125 | $144,782 |
| 2020 | $3,025 | $139,118 | $13,125 | $125,993 |
| 2019 | $3,198 | $142,434 | $13,125 | $129,309 |
| 2018 | $3,030 | $134,795 | $13,125 | $121,670 |
| 2017 | $2,758 | $122,541 | $13,125 | $109,416 |
| 2016 | $2,596 | $115,354 | $5,938 | $109,416 |
| 2015 | $2,308 | $118,963 | $5,938 | $113,025 |
| 2014 | $2,308 | $112,112 | $5,938 | $106,174 |
Source: Public Records
Map
Nearby Homes