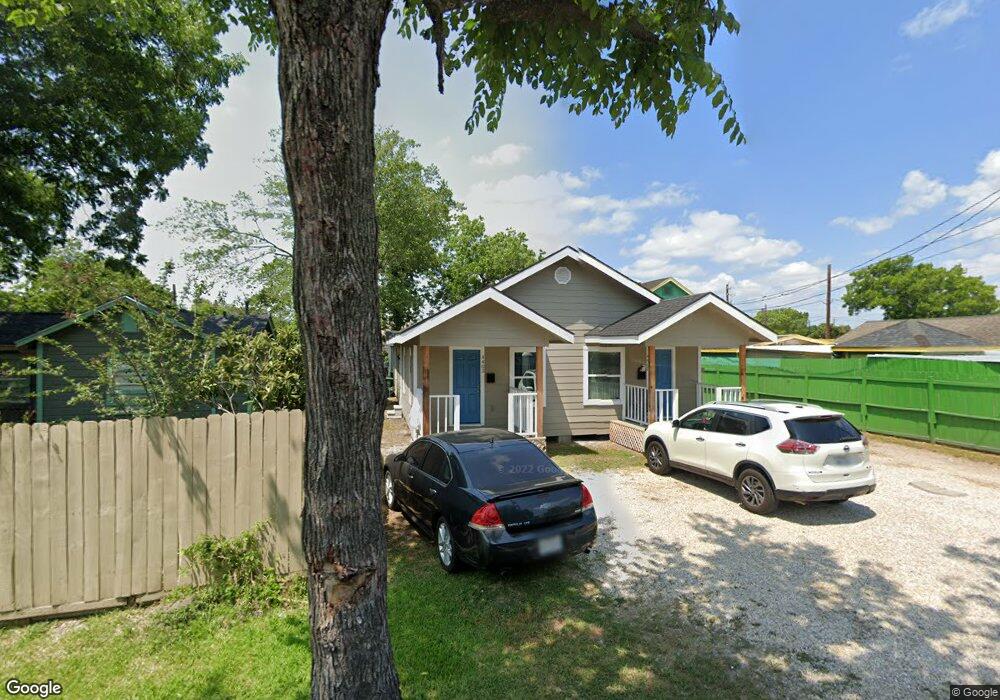
4403 Hull St Unit B Houston, TX 77021
OST-South Union NeighborhoodEstimated Value: $79,000 - $350,000
1
Bed
1
Bath
1,496
Sq Ft
$146/Sq Ft
Est. Value
About This Home
This home is located at 4403 Hull St Unit B, Houston, TX 77021 and is currently estimated at $218,500, approximately $146 per square foot. 4403 Hull St Unit B is a home located in Harris County with nearby schools including Peck Elementary School, Cullen Middle School, and Yates High School.
Ownership History
Date
Name
Owned For
Owner Type
Purchase Details
Closed on
Nov 23, 2021
Sold by
8Th Generation Investments Llc
Bought by
Casner Christian
Current Estimated Value
Home Financials for this Owner
Home Financials are based on the most recent Mortgage that was taken out on this home.
Original Mortgage
$182,000
Outstanding Balance
$167,002
Interest Rate
3.09%
Mortgage Type
New Conventional
Estimated Equity
$51,498
Purchase Details
Closed on
Feb 26, 2021
Sold by
Song Edward G
Bought by
Harkor Homes Llc
Home Financials for this Owner
Home Financials are based on the most recent Mortgage that was taken out on this home.
Original Mortgage
$155,000
Interest Rate
2.7%
Mortgage Type
Purchase Money Mortgage
Purchase Details
Closed on
Feb 24, 2021
Sold by
Harkor Homes Llc
Bought by
8Th Generations Investments Llc
Home Financials for this Owner
Home Financials are based on the most recent Mortgage that was taken out on this home.
Original Mortgage
$155,000
Interest Rate
2.7%
Mortgage Type
Purchase Money Mortgage
Purchase Details
Closed on
Oct 26, 2017
Sold by
Busby Ryan and Busby Shannon Elizabeth
Bought by
Song Edward G
Home Financials for this Owner
Home Financials are based on the most recent Mortgage that was taken out on this home.
Original Mortgage
$114,000
Interest Rate
3.78%
Mortgage Type
New Conventional
Purchase Details
Closed on
Jan 31, 2017
Sold by
Pinto Marilyn Cecilia
Bought by
Busby Ryan and Busby Shannon Elizabeth
Purchase Details
Closed on
Jan 27, 2014
Sold by
Wekan Development Llc
Bought by
Pinto Marilyn Cecilia and Su Casa Usa
Home Financials for this Owner
Home Financials are based on the most recent Mortgage that was taken out on this home.
Original Mortgage
$85,900
Interest Rate
4.49%
Mortgage Type
Purchase Money Mortgage
Purchase Details
Closed on
Oct 1, 2013
Sold by
Nationstar Mortgage Llc
Bought by
Wekan Development Llc
Purchase Details
Closed on
Feb 5, 2013
Sold by
Boone Keith D
Bought by
Nationstar Mortgage Llc
Purchase Details
Closed on
Jan 8, 2007
Sold by
Bridge Investments Inc
Bought by
Boone Keith D
Home Financials for this Owner
Home Financials are based on the most recent Mortgage that was taken out on this home.
Original Mortgage
$93,375
Interest Rate
6.09%
Mortgage Type
Purchase Money Mortgage
Create a Home Valuation Report for This Property
The Home Valuation Report is an in-depth analysis detailing your home's value as well as a comparison with similar homes in the area
Home Values in the Area
Average Home Value in this Area
Purchase History
| Date | Buyer | Sale Price | Title Company |
|---|---|---|---|
| Casner Christian | -- | None Listed On Document | |
| Casner Christian | -- | Stewart Title | |
| Casner Christian | -- | None Listed On Document | |
| Casner Christian | -- | Stewart Title | |
| Harkor Homes Llc | -- | Superior Abstract & Title | |
| Harkor Homes Llc | -- | Superior Abstract & Title | |
| 8Th Generations Investments Llc | -- | Select Title Llc | |
| 8Th Generations Investments Llc | -- | Select Title Llc | |
| Song Edward G | -- | None Available | |
| Song Edward G | -- | None Available | |
| Busby Ryan | -- | None Available | |
| Busby Ryan | -- | None Available | |
| Pinto Marilyn Cecilia | -- | Momentum Title Llc | |
| Pinto Marilyn Cecilia | -- | Momentum Title Llc | |
| Wekan Development Llc | -- | None Available | |
| Wekan Development Llc | -- | None Available | |
| Nationstar Mortgage Llc | $77,540 | None Available | |
| Nationstar Mortgage Llc | $77,540 | None Available | |
| Boone Keith D | -- | Fidelity National Title Co | |
| Boone Keith D | -- | Fidelity National Title Co |
Source: Public Records
Mortgage History
| Date | Status | Borrower | Loan Amount |
|---|---|---|---|
| Open | Casner Christian | $182,000 | |
| Previous Owner | 8Th Generations Investments Llc | $155,000 | |
| Previous Owner | Song Edward G | $114,000 | |
| Previous Owner | Pinto Marilyn Cecilia | $85,900 | |
| Previous Owner | Boone Keith D | $93,375 |
Source: Public Records
Tax History Compared to Growth
Tax History
| Year | Tax Paid | Tax Assessment Tax Assessment Total Assessment is a certain percentage of the fair market value that is determined by local assessors to be the total taxable value of land and additions on the property. | Land | Improvement |
|---|---|---|---|---|
| 2025 | $5,265 | $229,188 | $90,000 | $139,188 |
| 2024 | $5,265 | $251,635 | $90,000 | $161,635 |
| 2023 | $5,265 | $246,426 | $90,000 | $156,426 |
| 2022 | $4,473 | $203,161 | $70,000 | $133,161 |
| 2021 | $3,482 | $149,386 | $45,000 | $104,386 |
| 2020 | $2,543 | $105,023 | $30,000 | $75,023 |
| 2019 | $2,503 | $98,934 | $25,000 | $73,934 |
| 2018 | $2,258 | $89,240 | $20,000 | $69,240 |
| 2017 | $2,256 | $89,240 | $20,000 | $69,240 |
| 2016 | $1,893 | $74,878 | $20,000 | $54,878 |
| 2015 | $1,296 | $70,775 | $20,000 | $50,775 |
| 2014 | $1,296 | $50,400 | $12,500 | $37,900 |
Source: Public Records
Map
Nearby Homes
- 6301 Eastwood St
- 6602 Cullen Blvd
- 6834 Foster St
- 5910 Cullen Blvd
- 6631 Foster St
- 6627 Eastwood St
- 6614 London St Unit 12
- 6531 London St
- 0 Cullen Blvd
- 6711 Eastwood St
- 6636 New York St
- 6403 Goforth St
- 6637 New York St
- 6434 New York St
- 6710 New York St
- 6401 Goforth St
- 0 Sidney St Unit 28682136
- 6739 Foster St
- 6418 England St
- 6305 Eastwood St