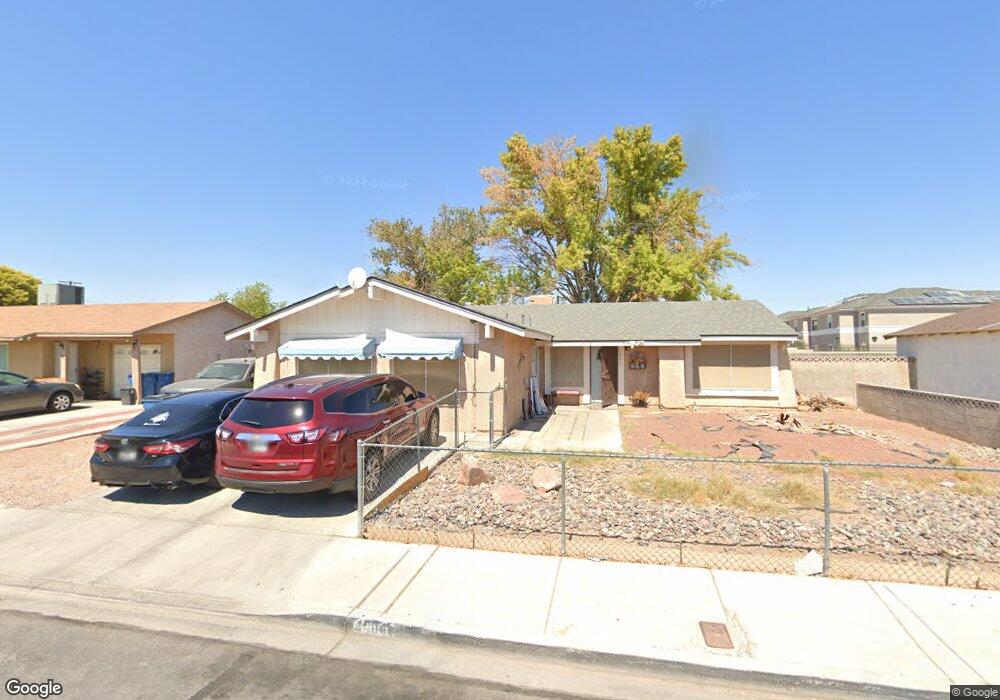
4404 Montebello Ave Unit 18 Las Vegas, NV 89110
East Las Vegas NeighborhoodEstimated Value: $392,000 - $396,000
5
Beds
3
Baths
1,635
Sq Ft
$241/Sq Ft
Est. Value
About This Home
This home is located at 4404 Montebello Ave Unit 18, Las Vegas, NV 89110 and is currently estimated at $394,399, approximately $241 per square foot. 4404 Montebello Ave Unit 18 is a home located in Clark County with nearby schools including Elbert Edwards Elementary School, Dell H Robison Middle School, and Eldorado High School.
Ownership History
Date
Name
Owned For
Owner Type
Purchase Details
Closed on
Oct 23, 2023
Sold by
Castillo Jeronimo T and Castillo Ana L
Bought by
Jarts8 Trust and Castillo
Current Estimated Value
Purchase Details
Closed on
Aug 2, 2011
Sold by
Alva Dinh Terry Pat and Dinh Sau
Bought by
Castillo Jeronimo T and Castillo Ana L
Home Financials for this Owner
Home Financials are based on the most recent Mortgage that was taken out on this home.
Original Mortgage
$48,000
Interest Rate
4.46%
Mortgage Type
New Conventional
Purchase Details
Closed on
Jul 21, 2003
Sold by
Alva Dinh Terry Pat and Alva Tammie Lynn
Bought by
Dinh Sau and Alva Dinh Terry Pat
Home Financials for this Owner
Home Financials are based on the most recent Mortgage that was taken out on this home.
Original Mortgage
$128,379
Interest Rate
5.15%
Mortgage Type
Unknown
Create a Home Valuation Report for This Property
The Home Valuation Report is an in-depth analysis detailing your home's value as well as a comparison with similar homes in the area
Home Values in the Area
Average Home Value in this Area
Purchase History
| Date | Buyer | Sale Price | Title Company |
|---|---|---|---|
| Jarts8 Trust | -- | None Listed On Document | |
| Castillo Jeronimo T | $60,000 | Fidelity National Title Las | |
| Dinh Sau | -- | Placer Title Company |
Source: Public Records
Mortgage History
| Date | Status | Borrower | Loan Amount |
|---|---|---|---|
| Previous Owner | Castillo Jeronimo T | $48,000 | |
| Previous Owner | Dinh Sau | $128,379 |
Source: Public Records
Tax History Compared to Growth
Tax History
| Year | Tax Paid | Tax Assessment Tax Assessment Total Assessment is a certain percentage of the fair market value that is determined by local assessors to be the total taxable value of land and additions on the property. | Land | Improvement |
|---|---|---|---|---|
| 2025 | $843 | $48,035 | $24,150 | $23,885 |
| 2024 | $819 | $48,035 | $24,150 | $23,885 |
| 2023 | $668 | $50,481 | $26,600 | $23,881 |
| 2022 | $834 | $45,029 | $22,750 | $22,279 |
| 2021 | $807 | $42,631 | $21,000 | $21,631 |
| 2020 | $773 | $41,165 | $19,250 | $21,915 |
| 2019 | $738 | $37,734 | $15,750 | $21,984 |
| 2018 | $704 | $34,707 | $13,300 | $21,407 |
| 2017 | $668 | $34,255 | $12,250 | $22,005 |
| 2016 | $668 | $29,849 | $7,000 | $22,849 |
| 2015 | $666 | $27,357 | $5,600 | $21,757 |
| 2014 | $646 | $20,552 | $4,200 | $16,352 |
Source: Public Records
Map
Nearby Homes
- 408 Rhoda St
- 413 N Lamb Blvd Unit F
- 425 N Lamb Blvd Unit D
- 4533 Diamond Head Dr
- 445 N Lamb Blvd Unit C
- 453 N Lamb Blvd Unit F
- 461 N Lamb Blvd Unit H
- 4428 Ash Ave
- 255 N Lamb Blvd Unit D
- 4436 E Ogden Ave
- 4509 Bingham Ave
- 574 Roxella Ln Unit A
- 574 Roxella Ln Unit C
- 4632 Shoen Ave
- 211 N Lamb Blvd Unit A
- 211 N Lamb Blvd Unit D
- 567 Roxella Ln Unit D
- 416 Martha St
- 579 Roxella Ln Unit D
- 217 N Lamb Blvd Unit C
- 4408 Montebello Ave
- 4400 Montebello Ave
- 4412 Montebello Ave
- 421 Whitman St
- 424 Rhoda St
- 428 Whitman St
- 4416 Montebello Ave
- 424 Whitman St
- 417 Whitman St
- 420 Rhoda St
- 420 Whitman St
- 4420 Montebello Ave
- 425 Rhoda St
- 413 Whitman St
- 416 Rhoda St
- 416 Whitman St
- 421 Rhoda St
- 4424 Montebello Ave
- 412 Rhoda St
- 4425 Montebello Ave