Estimated Value: $230,000 - $263,000
3
Beds
2
Baths
1,151
Sq Ft
$211/Sq Ft
Est. Value
About This Home
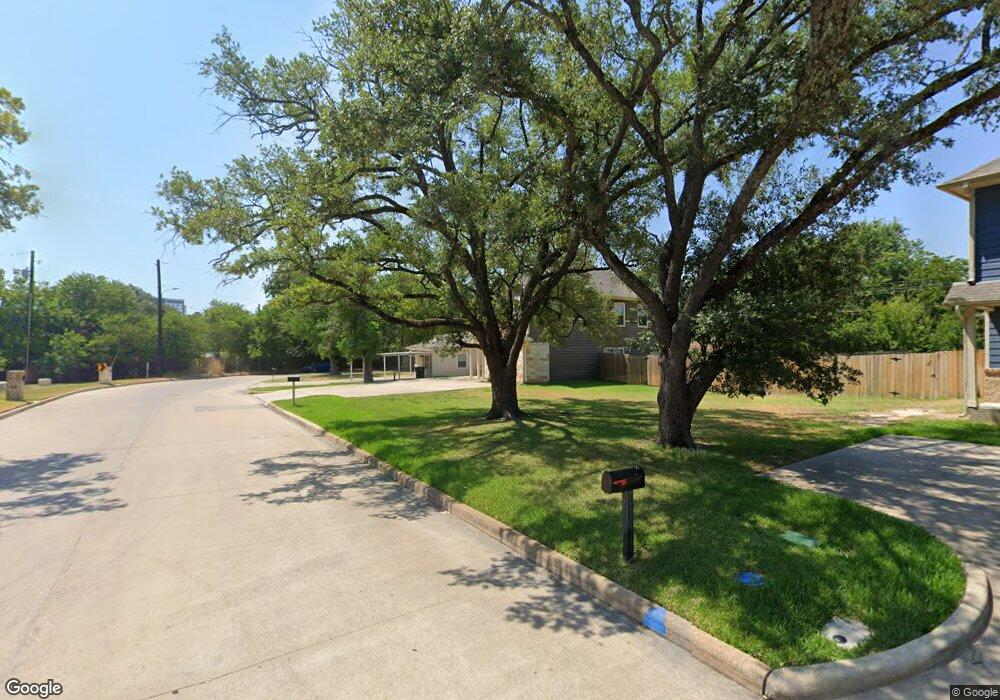
This home is located at 4404 Nagle St Unit COB, Bryan, TX 77801 and is currently estimated at $242,786, approximately $210 per square foot. 4404 Nagle St Unit COB is a home located in Brazos County with nearby schools including Crockett Elementary School, Long Intermediate School, and Bryan High School.
Ownership History
Date
Name
Owned For
Owner Type
Purchase Details
Closed on
Jun 7, 2023
Sold by
Dixon Financial Services Ltd
Bought by
Bryan Commerce And Development Inc
Current Estimated Value
Purchase Details
Closed on
Jun 6, 2023
Sold by
Dixon Financial Services Ltd
Bought by
Bryan Commerce And Development Inc
Purchase Details
Closed on
May 5, 2010
Sold by
Choudhry Mohammad G
Bought by
Jaffar Shabeer
Purchase Details
Closed on
Apr 16, 2010
Sold by
Choudhry Mohammad and Choudhry Shabana
Bought by
Dixon Financial Services Ltd
Purchase Details
Closed on
Sep 2, 2006
Sold by
Cinotto Charles and Cinotto Natalie
Bought by
Choudhry Mohammad G
Home Financials for this Owner
Home Financials are based on the most recent Mortgage that was taken out on this home.
Original Mortgage
$64,875
Interest Rate
6.72%
Mortgage Type
Purchase Money Mortgage
Purchase Details
Closed on
May 9, 2005
Sold by
Lozano Josie
Bought by
Rodriguez Joseph E
Create a Home Valuation Report for This Property
The Home Valuation Report is an in-depth analysis detailing your home's value as well as a comparison with similar homes in the area
Purchase History
We collect this data history from publicly available records. To have your information removed, we recommend requesting removal directly through your county’s website.
| Date | Buyer | Sale Price | Title Company |
|---|---|---|---|
| Bryan Commerce And Development Inc | $250,000 | None Listed On Document | |
| Bryan Commerce And Development Inc | $250,000 | None Listed On Document | |
| Jaffar Shabeer | $61,116 | None Available | |
| Dixon Financial Services Ltd | -- | Aggieland Title Company | |
| Choudhry Mohammad G | -- | University Title Company | |
| Rodriguez Joseph E | -- | None Available |
Source: Public Records
Mortgage History
We collect this data history from publicly available records. To have your information removed, we recommend requesting removal directly through your county’s website.
| Date | Status | Borrower | Loan Amount |
|---|---|---|---|
| Previous Owner | Choudhry Mohammad G | $64,875 |
Source: Public Records
Tax History
| Year | Tax Paid | Tax Assessment Tax Assessment Total Assessment is a certain percentage of the fair market value that is determined by local assessors to be the total taxable value of land and additions on the property. | Land | Improvement |
|---|---|---|---|---|
| 2025 | $4,113 | $203,264 | $203,264 | -- |
| 2024 | $4,113 | $192,701 | $192,701 | -- |
| 2023 | $4,113 | $207,442 | $174,515 | $32,927 |
| 2022 | $4,330 | $197,431 | $174,515 | $22,916 |
| 2021 | $4,352 | $184,700 | $180,302 | $4,398 |
| 2020 | $4,431 | $184,832 | $180,302 | $4,530 |
| 2019 | $4,273 | $174,040 | $169,920 | $4,120 |
| 2018 | $4,202 | $171,150 | $167,030 | $4,120 |
| 2017 | $3,636 | $147,500 | $143,380 | $4,120 |
| 2016 | $3,355 | $136,100 | $123,170 | $12,930 |
| 2015 | $2,820 | $139,000 | $101,040 | $37,960 |
| 2014 | $2,820 | $117,250 | $59,700 | $57,550 |
Source: Public Records
Map
Nearby Homes
- 212 Inlow Blvd
- 4400 Milam St
- 4208 Oaklawn St
- 4206 Oaklawn St
- 4305 College Main St
- 307/309 Cherry St
- 305 Cherry St
- 3525 Brayden Dr
- 508 and 510 Clay St
- 510 Clay St
- 508 Clay St
- 4101 College Main St
- 400 Nagle St Unit 400
- 400 Nagle St Unit 304
- 400 Nagle St Unit 203
- 401 Louise Ave
- 505 & 507, 500 & 502 Boyett First St
- 505 & 507, 500 & 502 Boyett & First St Unit A1-4, B 1-4, C1-4 &
- 4441 Old College Rd Unit 6-203
- 4441 Old College Rd Unit 7202
- 4400 Nagle St Unit COB
- 406 Foch St
- 4336 Nagle St Unit COB
- 232 Inlow Blvd
- 228 Inlow Blvd
- 311 Foch St
- 401 Foch St
- 4401 Nagle St
- 4403 Nagle St
- 4403 Oaklawn St
- 224 Inlow Blvd
- 408 Foch St
- 409 Foch St
- 405 Foch St
- 4332 Nagle St Unit COB
- 307 Foch St
- 307 Foch St Unit A
- 220 Inlow Blvd
- 309 Foch St
- 4313 Oaklawn St
Your Personal Tour Guide
Ask me questions while you tour the home.