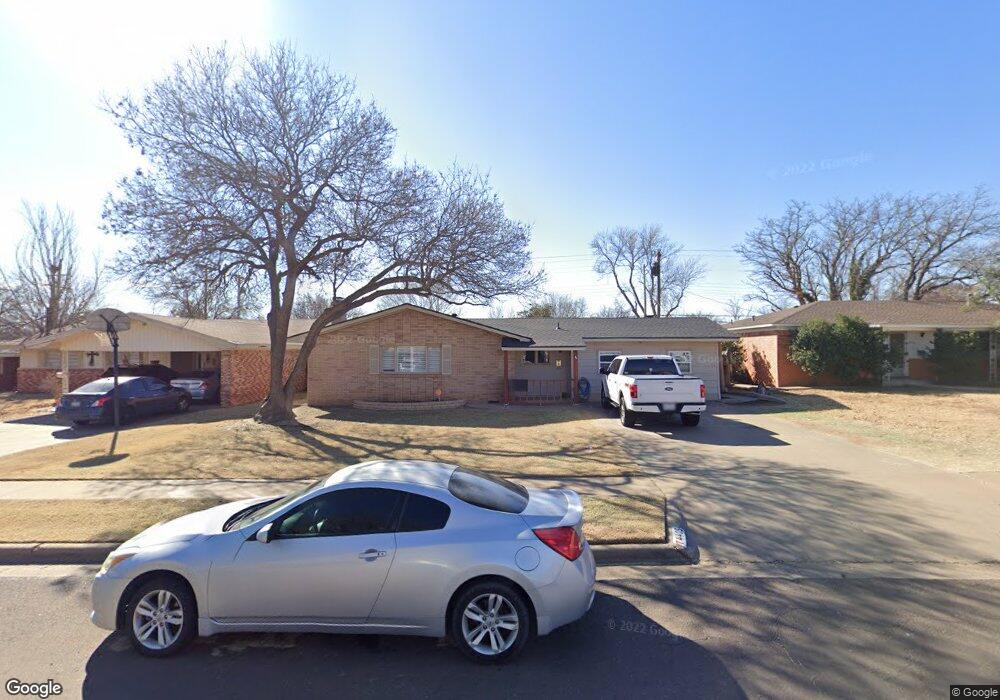
4405 27th St Lubbock, TX 79410
Coronado NeighborhoodEstimated Value: $191,000 - $225,000
4
Beds
2
Baths
1,805
Sq Ft
$117/Sq Ft
Est. Value
About This Home
This home is located at 4405 27th St, Lubbock, TX 79410 and is currently estimated at $211,676, approximately $117 per square foot. 4405 27th St is a home located in Lubbock County with nearby schools including Overton Elementary School, Commander William C. McCool Academy, and Mackenzie Middle School.
Ownership History
Date
Name
Owned For
Owner Type
Purchase Details
Closed on
May 2, 2024
Sold by
Garza Rebecca and Lopez Rebecca
Bought by
Olsen Jeff and Olsen Alison
Current Estimated Value
Home Financials for this Owner
Home Financials are based on the most recent Mortgage that was taken out on this home.
Original Mortgage
$168,750
Outstanding Balance
$166,224
Interest Rate
6.87%
Mortgage Type
New Conventional
Estimated Equity
$45,452
Purchase Details
Closed on
Feb 25, 2013
Sold by
Rodriguez Michael Alexander and Vega Sandra
Bought by
Garza Rebecca
Home Financials for this Owner
Home Financials are based on the most recent Mortgage that was taken out on this home.
Original Mortgage
$108,007
Interest Rate
3.5%
Mortgage Type
FHA
Purchase Details
Closed on
Jan 15, 2000
Sold by
Martin Keith Aubry
Bought by
Garza Rebecca
Purchase Details
Closed on
Aug 21, 1987
Sold by
Cates Alta Bowers
Bought by
Garza Rebecca
Create a Home Valuation Report for This Property
The Home Valuation Report is an in-depth analysis detailing your home's value as well as a comparison with similar homes in the area
Home Values in the Area
Average Home Value in this Area
Purchase History
| Date | Buyer | Sale Price | Title Company |
|---|---|---|---|
| Olsen Jeff | -- | True Title | |
| Garza Rebecca | -- | Title One | |
| Garza Rebecca | -- | -- | |
| Garza Rebecca | -- | -- |
Source: Public Records
Mortgage History
| Date | Status | Borrower | Loan Amount |
|---|---|---|---|
| Open | Olsen Jeff | $168,750 | |
| Previous Owner | Garza Rebecca | $108,007 |
Source: Public Records
Tax History Compared to Growth
Tax History
| Year | Tax Paid | Tax Assessment Tax Assessment Total Assessment is a certain percentage of the fair market value that is determined by local assessors to be the total taxable value of land and additions on the property. | Land | Improvement |
|---|---|---|---|---|
| 2025 | $1,838 | $162,803 | $30,000 | $132,803 |
| 2024 | $1,838 | $151,216 | $30,000 | $121,216 |
| 2023 | $2,689 | $144,671 | $13,650 | $131,021 |
| 2022 | $2,748 | $135,758 | $13,650 | $122,108 |
| 2021 | $2,467 | $115,181 | $13,650 | $101,531 |
| 2020 | $2,218 | $102,004 | $13,650 | $88,354 |
| 2019 | $2,342 | $104,329 | $13,650 | $90,679 |
| 2018 | $2,345 | $104,329 | $13,650 | $90,679 |
| 2017 | $2,034 | $90,379 | $13,650 | $76,729 |
| 2016 | $1,866 | $82,904 | $6,175 | $76,729 |
| 2015 | $1,925 | $86,600 | $6,175 | $80,425 |
| 2014 | $1,925 | $86,566 | $6,175 | $80,391 |
Source: Public Records
Map
Nearby Homes