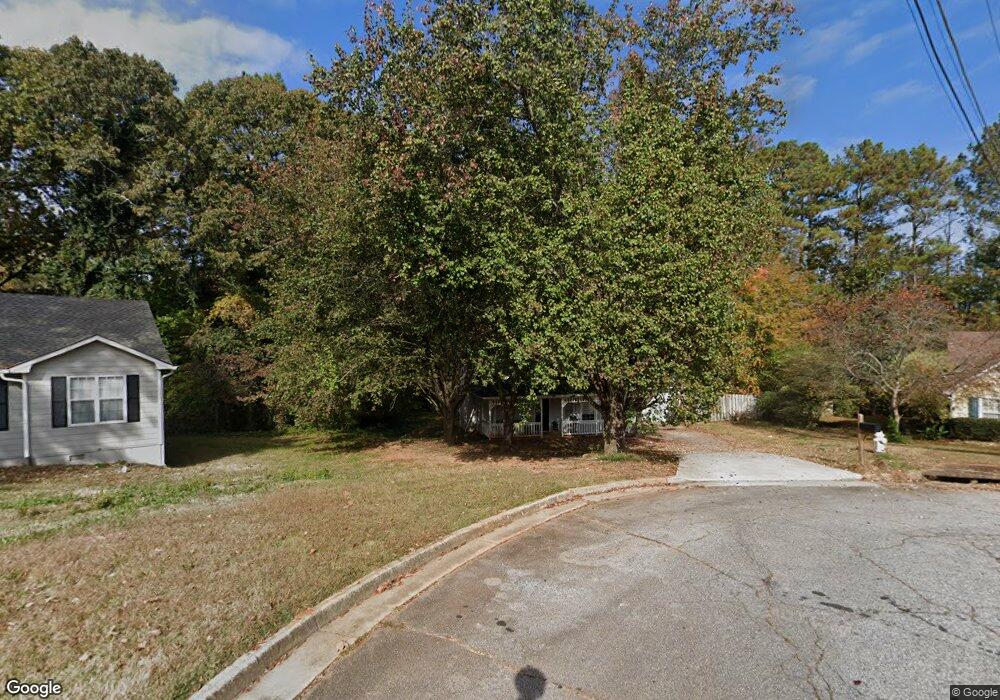
4405 Cindy Place SE Conyers, GA 30094
Estimated Value: $210,283 - $245,000
3
Beds
2
Baths
1,260
Sq Ft
$183/Sq Ft
Est. Value
About This Home
This home is located at 4405 Cindy Place SE, Conyers, GA 30094 and is currently estimated at $230,071, approximately $182 per square foot. 4405 Cindy Place SE is a home located in Rockdale County with nearby schools including Sims Elementary School, Edwards Middle School, and Heritage High School.
Ownership History
Date
Name
Owned For
Owner Type
Purchase Details
Closed on
Dec 7, 2020
Sold by
Clark Lynette
Bought by
Sfr Jv 1 Property Llc
Current Estimated Value
Purchase Details
Closed on
Sep 14, 2006
Sold by
Tate Hellena C
Bought by
Clark Lynette M
Home Financials for this Owner
Home Financials are based on the most recent Mortgage that was taken out on this home.
Original Mortgage
$112,005
Interest Rate
6.31%
Mortgage Type
FHA
Purchase Details
Closed on
Jan 31, 2005
Sold by
Fannie Mae
Bought by
Tate Hellena C
Home Financials for this Owner
Home Financials are based on the most recent Mortgage that was taken out on this home.
Original Mortgage
$11,000
Interest Rate
5.72%
Mortgage Type
Stand Alone Refi Refinance Of Original Loan
Purchase Details
Closed on
Oct 5, 2004
Sold by
Mers Inc
Bought by
Fedl Natl Mtg Assn
Create a Home Valuation Report for This Property
The Home Valuation Report is an in-depth analysis detailing your home's value as well as a comparison with similar homes in the area
Home Values in the Area
Average Home Value in this Area
Purchase History
| Date | Buyer | Sale Price | Title Company |
|---|---|---|---|
| Sfr Jv 1 Property Llc | $150,000 | -- | |
| Clark Lynette M | $113,800 | -- | |
| Tate Hellena C | -- | -- | |
| Fedl Natl Mtg Assn | -- | -- | |
| Mers Inc | $103,098 | -- |
Source: Public Records
Mortgage History
| Date | Status | Borrower | Loan Amount |
|---|---|---|---|
| Previous Owner | Clark Lynette M | $112,005 | |
| Previous Owner | Tate Hellena C | $11,000 |
Source: Public Records
Tax History Compared to Growth
Tax History
| Year | Tax Paid | Tax Assessment Tax Assessment Total Assessment is a certain percentage of the fair market value that is determined by local assessors to be the total taxable value of land and additions on the property. | Land | Improvement |
|---|---|---|---|---|
| 2024 | $2,891 | $71,200 | $13,660 | $57,540 |
| 2023 | $2,962 | $71,200 | $13,660 | $57,540 |
| 2022 | $3,009 | $72,400 | $14,520 | $57,880 |
| 2021 | $2,241 | $53,720 | $8,000 | $45,720 |
| 2020 | $788 | $40,520 | $6,400 | $34,120 |
| 2019 | $794 | $40,120 | $6,000 | $34,120 |
| 2018 | $471 | $29,520 | $5,200 | $24,320 |
| 2017 | $293 | $23,640 | $4,240 | $19,400 |
| 2016 | $272 | $23,640 | $4,240 | $19,400 |
| 2015 | $202 | $21,200 | $4,240 | $16,960 |
| 2014 | $161 | $20,160 | $3,200 | $16,960 |
| 2013 | -- | $36,880 | $8,760 | $28,120 |
Source: Public Records
Map
Nearby Homes
- 340 Windsor Walk SE
- 309 Windsor Walk SE Unit 1
- 2631 Rolling Hills Way SE
- 1601 Creek Crossing SE
- 2370 Ebenezer Rd SE
- 1420 Hillside Place SE
- 250 Smile Dr SE
- 1508 Hillside Dr SE
- 170 Old Mill Trail SW
- 1511 Hillside Dr SE
- 2617 Laurel Woods Ln SE Unit 3
- Boston Plan at Millers Pointe
- 1911 Colestock Ave SE
- Atlanta Plan at Millers Pointe
- Columbus Plan at Millers Pointe
- 2464 Lennox Rd SE
- 2537 Lennox Rd SE
- 1624 Sugarmaple Ln SW
- 1598 Cherry Hill Ln SW Unit 5
- 2608 Downing Park Dr SE
- 4405 Cindy Place SE Unit 3
- 4406 Cindy Place SE Unit 3
- 4403 Cindy Place SE
- 3404 Vernon Ct SE
- 3402 Vernon Ct SE
- 4404 Cindy Place SE
- 4402 Cindy Place SE
- 4402 Cindy Place SE
- 378 Cindy Dr SE
- 3400 Vernon Ct SE
- 382 Cindy Dr SE
- 3403 Vernon Ct SE
- 5407 Cindy Ln SE
- 5405 Cindy Ln SE Unit 4
- 5409 Cindy Ln SE
- 5403 Cindy Ln SE
- 5411 Cindy Ln SE Unit 4
- 3401 Vernon Ct SE
- 5401 Cindy Ln SE
- 5413 Cindy Ln SE Unit 4