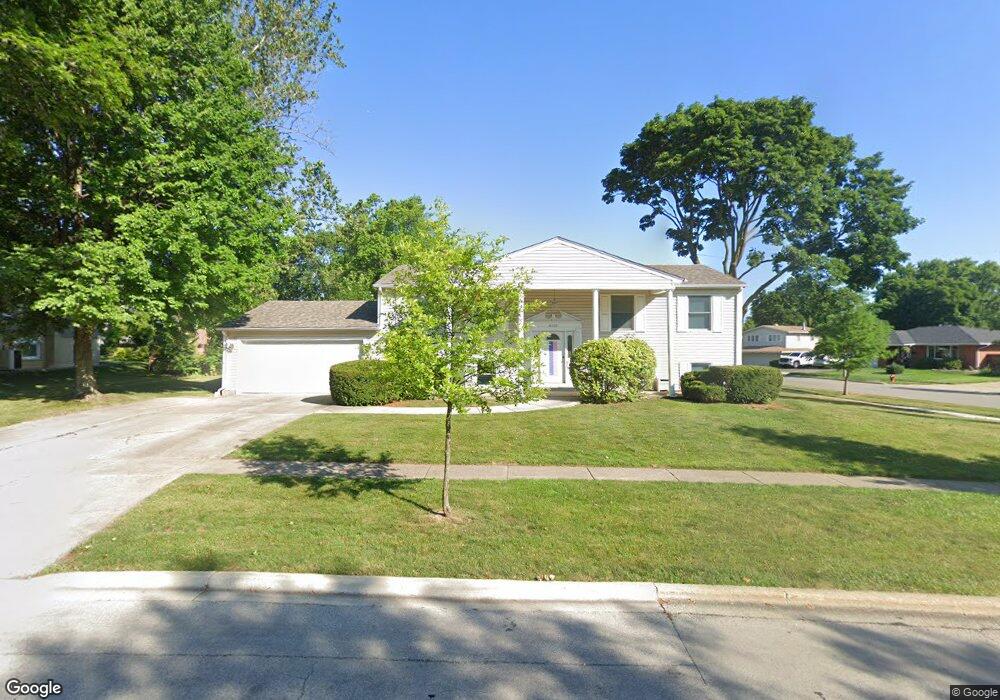
4405 Thorntree Ln Rolling Meadows, IL 60008
Busse Woods NeighborhoodEstimated Value: $343,000 - $468,000
3
Beds
3
Baths
1,262
Sq Ft
$321/Sq Ft
Est. Value
About This Home
This home is located at 4405 Thorntree Ln, Rolling Meadows, IL 60008 and is currently estimated at $404,850, approximately $320 per square foot. 4405 Thorntree Ln is a home located in Cook County with nearby schools including Willow Bend Elementary School, Carl Sandburg Junior High School, and Rolling Meadows High School.
Ownership History
Date
Name
Owned For
Owner Type
Purchase Details
Closed on
Dec 14, 2016
Sold by
Funk Art
Bought by
Funk Nancy
Current Estimated Value
Purchase Details
Closed on
Jun 29, 2001
Sold by
Owen Neal and Owen Mary
Bought by
Funk Arthur S and Funk Nancy M
Home Financials for this Owner
Home Financials are based on the most recent Mortgage that was taken out on this home.
Original Mortgage
$160,000
Outstanding Balance
$59,350
Interest Rate
7.27%
Estimated Equity
$345,500
Purchase Details
Closed on
Aug 10, 2000
Sold by
Lortie Frances L
Bought by
Owen Neal and Owen Mary
Home Financials for this Owner
Home Financials are based on the most recent Mortgage that was taken out on this home.
Original Mortgage
$177,750
Interest Rate
7.96%
Create a Home Valuation Report for This Property
The Home Valuation Report is an in-depth analysis detailing your home's value as well as a comparison with similar homes in the area
Home Values in the Area
Average Home Value in this Area
Purchase History
| Date | Buyer | Sale Price | Title Company |
|---|---|---|---|
| Funk Nancy | -- | None Available | |
| Funk Arthur S | $285,000 | -- | |
| Owen Neal | -- | Professional National Title |
Source: Public Records
Mortgage History
| Date | Status | Borrower | Loan Amount |
|---|---|---|---|
| Open | Funk Arthur S | $160,000 | |
| Previous Owner | Owen Neal | $177,750 |
Source: Public Records
Tax History
| Year | Tax Paid | Tax Assessment Tax Assessment Total Assessment is a certain percentage of the fair market value that is determined by local assessors to be the total taxable value of land and additions on the property. | Land | Improvement |
|---|---|---|---|---|
| 2025 | $8,455 | $38,001 | $11,486 | $26,515 |
| 2024 | $8,455 | $31,000 | $9,672 | $21,328 |
| 2023 | $8,059 | $31,000 | $9,672 | $21,328 |
| 2022 | $8,059 | $31,000 | $9,672 | $21,328 |
| 2021 | $4,810 | $17,933 | $6,347 | $11,586 |
| 2020 | $4,770 | $17,933 | $6,347 | $11,586 |
| 2019 | $4,838 | $20,150 | $6,347 | $13,803 |
| 2018 | $7,044 | $25,283 | $5,440 | $19,843 |
| 2017 | $6,920 | $25,283 | $5,440 | $19,843 |
| 2016 | $6,703 | $25,283 | $5,440 | $19,843 |
| 2015 | $6,377 | $22,979 | $4,836 | $18,143 |
| 2014 | $6,242 | $22,979 | $4,836 | $18,143 |
| 2013 | $6,074 | $22,979 | $4,836 | $18,143 |
Source: Public Records
Map
Nearby Homes
- 2830 Northampton Dr Unit A1
- 5001 Carriage Way Dr Unit 116
- 5000 Carriageway Dr Unit 305
- 5000 Carriageway Dr Unit 315
- 5000 Carriageway Dr Unit 211
- 3200 Thrush Ln
- 3712 Jay Ln
- 2508 Algonquin Rd Unit 16
- 399 Knollwood Ct
- 2504 Algonquin Rd Unit 14
- 5201 Carriageway Dr Unit C317
- 2302 Fulle St
- 2402 Algonquin Rd Unit 9
- 1813 Hemlock Place Unit 311
- 3605 Oriole Ln
- 3135 Town Square Dr Unit 401
- 3135 Town Square Dr Unit 104
- 1117 S Old Wilke Rd Unit 206
- 3345 Kirchoff Rd Unit 5C
- 3209 Trillium Cir
- 3403 Brookmeade Dr
- 4407 Thorntree Ln
- 3309 Brookmeade Dr
- 4501 Thorntree Ln
- 4502 Thorntree Ln
- 4404 Magnolia Dr
- 3405 Brookmeade Dr
- 4406 Magnolia Dr
- 3316 Brookmeade Dr
- 3314 Brookmeade Dr
- 3400 Brookmeade Dr
- 3312 Brookmeade Dr
- 4503 Thorntree Ln
- 4500 Magnolia Dr Unit 4
- 3402 Brookmeade Dr
- 4504 Thorntree Ln
- 3307 Brookmeade Dr
- 3310 Brookmeade Dr
- 3404 Brookmeade Dr
- 4502 Magnolia Dr Unit 4
Your Personal Tour Guide
Ask me questions while you tour the home.