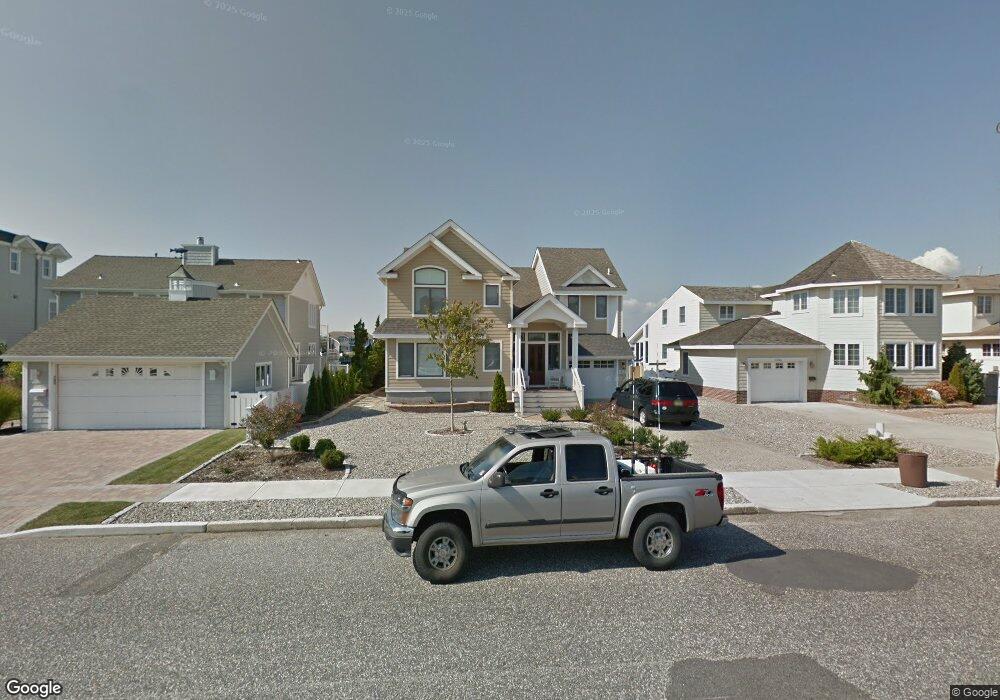
4406 5th Ave Avalon, NJ 08202
Estimated Value: $4,628,000 - $6,402,000
--
Bed
--
Bath
2,787
Sq Ft
$1,915/Sq Ft
Est. Value
About This Home
This home is located at 4406 5th Ave, Avalon, NJ 08202 and is currently estimated at $5,337,785, approximately $1,915 per square foot. 4406 5th Ave is a home located in Cape May County with nearby schools including Avalon Elementary School.
Ownership History
Date
Name
Owned For
Owner Type
Purchase Details
Closed on
Aug 29, 2022
Sold by
Maureen B Mischler Qualified Personal Re
Bought by
Maureen B Mischler Qualifield Personal Reside
Current Estimated Value
Purchase Details
Closed on
Aug 28, 2012
Sold by
The Maureen B Mischler Revocable Trust
Bought by
The Maureen B Mischler Qualified Persona
Purchase Details
Closed on
Mar 1, 2010
Sold by
Mischler Frederick C and Mischler Maureen B
Bought by
The Maureen B Mischler Revocable Trust
Create a Home Valuation Report for This Property
The Home Valuation Report is an in-depth analysis detailing your home's value as well as a comparison with similar homes in the area
Home Values in the Area
Average Home Value in this Area
Purchase History
| Date | Buyer | Sale Price | Title Company |
|---|---|---|---|
| Maureen B Mischler Qualifield Personal Reside | -- | -- | |
| The Maureen B Mischler Qualified Persona | -- | None Available | |
| The Maureen B Mischler Revocable Trust | -- | None Available |
Source: Public Records
Tax History Compared to Growth
Tax History
| Year | Tax Paid | Tax Assessment Tax Assessment Total Assessment is a certain percentage of the fair market value that is determined by local assessors to be the total taxable value of land and additions on the property. | Land | Improvement |
|---|---|---|---|---|
| 2025 | $17,083 | $2,782,300 | $2,400,000 | $382,300 |
| 2024 | $17,083 | $2,782,300 | $2,400,000 | $382,300 |
| 2023 | $16,944 | $2,782,300 | $2,400,000 | $382,300 |
| 2022 | $15,803 | $2,782,300 | $2,400,000 | $382,300 |
| 2021 | $15,219 | $2,782,300 | $2,400,000 | $382,300 |
| 2020 | $14,635 | $2,782,300 | $2,400,000 | $382,300 |
| 2019 | $14,190 | $2,782,300 | $2,400,000 | $382,300 |
| 2018 | $13,578 | $2,782,300 | $2,400,000 | $382,300 |
| 2017 | $11,429 | $2,055,600 | $1,700,000 | $355,600 |
| 2016 | $11,306 | $2,055,600 | $1,700,000 | $355,600 |
| 2015 | $11,121 | $2,055,600 | $1,700,000 | $355,600 |
| 2014 | $10,997 | $1,980,800 | $1,700,000 | $280,800 |
Source: Public Records
Map
Nearby Homes