


4408 N Pioneer Way Unit 1 Las Vegas, NV 89129
Lone Mountain NeighborhoodEstimated payment $4,283/month
Highlights
- Heated Pool and Spa
- Fireplace in Bedroom
- Private Yard
- RV Access or Parking
- Wood Flooring
- Outdoor Water Feature
About This Home
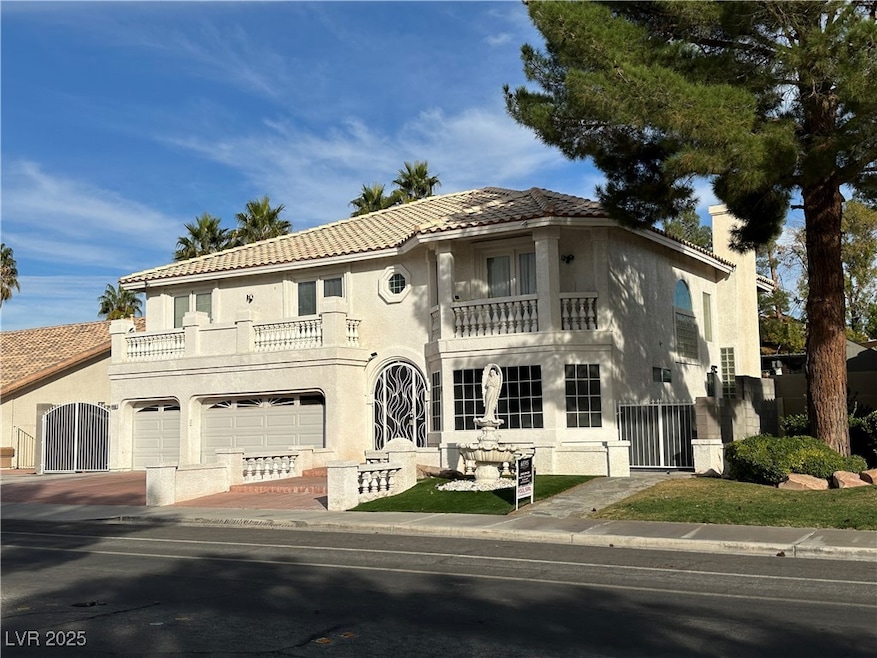
American West Homes former model home with a motivated Seller! Lovely floor plan two-story home approximately 3713 square feet home built in 1992. This gem has 4 bedrooms, (3 with balcony), a den, 3 baths, 3-car garage, and an RV parking. Comes with 3 cozy fireplaces with glass fronts. A covered patio overlooks the backyard. Zero maintenance yard, with pergola, and a heated in ground pool with spa. High ceilings in the formal dining and the living room. Island kitchen with recessed lighting, tray ceiling, and overlooks the breakfast nook and cozy family room with brick fireplace. Den with hardwood floors and mirror walls. Master bedroom suite with fireplace, huge walk-in closet, and a master bath with jetted bath tub, walk-in shower, dual sinks, and water closet. Floors are wood, tile, and laminate. All kitchen appliances plus washer and dryer are included. Don’t miss this great potential property!
Listing Agent
Executive Realty Services Brokerage Phone: (702) 334-0086 License #S.0035202 Listed on: 10/24/2025
Home Details
Home Type
- Single Family
Est. Annual Taxes
- $3,876
Year Built
- Built in 1992
Lot Details
- 6,970 Sq Ft Lot
- West Facing Home
- Property is Fully Fenced
- Block Wall Fence
- Private Yard
HOA Fees
- $26 Monthly HOA Fees
Parking
- 3 Car Attached Garage
- Inside Entrance
- Garage Door Opener
- RV Access or Parking
Home Design
- Pitched Roof
- Tile Roof
- Stucco
Interior Spaces
- 3,713 Sq Ft Home
- 2-Story Property
- Ceiling Fan
- Fireplace With Glass Doors
- Gas Fireplace
- Double Pane Windows
- Blinds
- Family Room with Fireplace
- 3 Fireplaces
- Living Room with Fireplace
Kitchen
- Breakfast Area or Nook
- Double Oven
- Built-In Electric Oven
- Gas Cooktop
- Microwave
- Dishwasher
- Pots and Pans Drawers
- Disposal
Flooring
- Wood
- Linoleum
- Tile
- Vinyl
Bedrooms and Bathrooms
- 4 Bedrooms
- Fireplace in Bedroom
Laundry
- Laundry Room
- Laundry on main level
- Dryer
- Washer
Eco-Friendly Details
- Energy-Efficient Windows
Pool
- Heated Pool and Spa
- Heated In Ground Pool
Outdoor Features
- Courtyard
- Covered Patio or Porch
- Outdoor Water Feature
Schools
- Deskin Elementary School
- Leavitt Justice Myron E Middle School
- Centennial High School
Utilities
- Two cooling system units
- Central Heating and Cooling System
- Multiple Heating Units
- Heating System Uses Gas
- Underground Utilities
- 220 Volts in Garage
- Cable TV Available
Community Details
- Association fees include security
- Deerbrooke Association, Phone Number (702) 458-2580
- Built by American W
- Sedona Subdivision
Map
Home Values in the Area
Average Home Value in this Area
Tax History
| Year | Tax Paid | Tax Assessment Tax Assessment Total Assessment is a certain percentage of the fair market value that is determined by local assessors to be the total taxable value of land and additions on the property. | Land | Improvement |
|---|---|---|---|---|
| 2025 | $3,876 | $158,364 | $45,850 | $112,514 |
| 2024 | $3,632 | $158,364 | $45,850 | $112,514 |
| 2023 | $3,632 | $149,325 | $45,500 | $103,825 |
| 2022 | $3,527 | $134,485 | $38,850 | $95,635 |
| 2021 | $3,424 | $125,290 | $33,950 | $91,340 |
| 2020 | $3,321 | $124,596 | $33,600 | $90,996 |
| 2019 | $3,281 | $121,171 | $31,150 | $90,021 |
| 2018 | $3,131 | $110,644 | $24,150 | $86,494 |
| 2017 | $3,633 | $110,818 | $22,750 | $88,068 |
| 2016 | $2,930 | $108,459 | $18,200 | $90,259 |
| 2015 | $2,924 | $89,859 | $15,750 | $74,109 |
| 2014 | $2,833 | $83,867 | $10,500 | $73,367 |
Property History
| Date | Event | Price | List to Sale | Price per Sq Ft |
|---|---|---|---|---|
| 10/24/2025 10/24/25 | For Sale | $750,000 | -- | $202 / Sq Ft |
Purchase History
| Date | Type | Sale Price | Title Company |
|---|---|---|---|
| Bargain Sale Deed | $270,000 | Old Republic Title Company | |
| Grant Deed | $265,000 | First American Title Company |
Mortgage History
| Date | Status | Loan Amount | Loan Type |
|---|---|---|---|
| Open | $216,000 | No Value Available | |
| Previous Owner | $185,500 | No Value Available |
Source: Las Vegas REALTORS®
MLS Number: 2728859
APN: 138-03-215-018
Disclaimer: Certain information contained herein is derived from information provided by parties other than Homes.com. All information provided is deemed reliable, but is not guaranteed to be accurate and should be independently verified.
![]() The data relating to real estate for sale on this web site comes in part from the INTERNET DATA EXCHANGE Program of the Greater Las Vegas Association of REALTORS® MLS. Real estate listings held by brokerage firms other than this site owner are marked with the IDX logo. Information is deemed reliable but not guaranteed. Copyright 2025 of the Greater Las Vegas Association of REALTORS® MLS. All rights reserved.
The data relating to real estate for sale on this web site comes in part from the INTERNET DATA EXCHANGE Program of the Greater Las Vegas Association of REALTORS® MLS. Real estate listings held by brokerage firms other than this site owner are marked with the IDX logo. Information is deemed reliable but not guaranteed. Copyright 2025 of the Greater Las Vegas Association of REALTORS® MLS. All rights reserved.
- 4412 N Pioneer Way
- 4404 Dunlap Crossing St Unit 2
- 4400 Dunlap Crossing St
- 7418 Lawrence Powers Ct
- 7425 Enchanted Hills Ct
- 7504 Heather Knoll Cir
- 7505 Cobal Canyon Ln
- 7349 Dolphine Crest Ave
- 7461 Tahoe Basin Dr
- 4533 Vogue St
- 4356 Perfect Drift St
- 0 N Tenaya Way
- 4252 Olympic Point Dr
- 3351 Dancing Waters St
- 3344 Dancing Waters St
- 3350 Dancing Waters St
- 4205 Thunder Twice St
- 7132 Junction Village Ave
- 4224 Perfect Drift St
- 7251 Daily Double Ave
- 4413 Ornate Ct
- 4268 Perfect Drift St
- 7329 Halsey Ct
- 4205 Lentil Ct
- 4212 Haven Hurst Ct Unit 10
- 4140 Brassy Boots Ct
- 7032 Golden Desert Ave Unit 4
- 4112 N Dream Day St
- 4821 Black Bear Rd Unit 104
- 4041 Hazelridge Dr
- 6948 W Atrium Ave
- 6928 Atrium Ave Unit 3
- 3969 Jazzy Ginger Ct
- 6928 Oyster Shell Dr
- 4970 Black Bear Rd Unit 202
- 6885 W Lone Mountain Rd
- 7125 W Tropical Island Cir
- 5081 N Pioneer Way Unit B
- 4650 N Rainbow Blvd
- 3916 Varallo St
