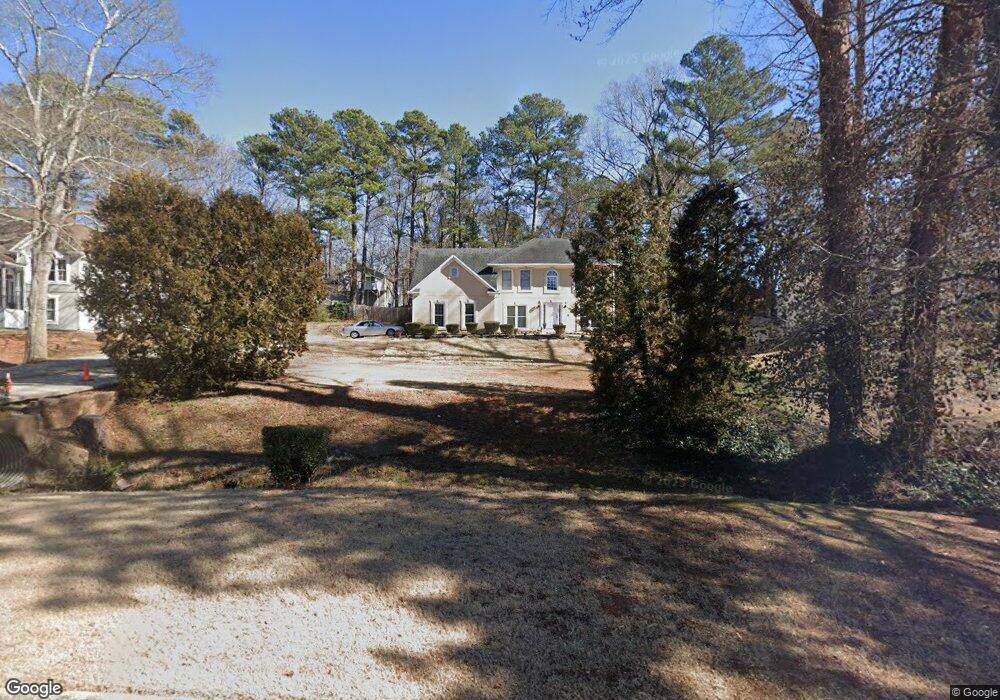
4408 Oakleaf Cove Unit 1 Decatur, GA 30034
Southwest DeKalb NeighborhoodEstimated Value: $336,000 - $372,000
4
Beds
3
Baths
2,207
Sq Ft
$159/Sq Ft
Est. Value
About This Home
This home is located at 4408 Oakleaf Cove Unit 1, Decatur, GA 30034 and is currently estimated at $351,786, approximately $159 per square foot. 4408 Oakleaf Cove Unit 1 is a home located in DeKalb County with nearby schools including Chapel Hill Elementary School, Chapel Hill Middle School, and Southwest Dekalb High School.
Ownership History
Date
Name
Owned For
Owner Type
Purchase Details
Closed on
Apr 17, 2018
Sold by
Anderson Leslie C
Bought by
Anderson Leslie C and Anderson Jeanette L
Current Estimated Value
Home Financials for this Owner
Home Financials are based on the most recent Mortgage that was taken out on this home.
Original Mortgage
$157,377
Outstanding Balance
$135,373
Interest Rate
4.45%
Mortgage Type
VA
Estimated Equity
$216,413
Purchase Details
Closed on
May 27, 1997
Sold by
Betton Wilbert and Betton Bobby J
Bought by
Anderson Leslie C
Home Financials for this Owner
Home Financials are based on the most recent Mortgage that was taken out on this home.
Original Mortgage
$119,920
Interest Rate
8.13%
Mortgage Type
New Conventional
Purchase Details
Closed on
Oct 27, 1995
Sold by
Morrison Home Of Florida Inc
Bought by
Betton Wilbert Bobby J
Create a Home Valuation Report for This Property
The Home Valuation Report is an in-depth analysis detailing your home's value as well as a comparison with similar homes in the area
Home Values in the Area
Average Home Value in this Area
Purchase History
| Date | Buyer | Sale Price | Title Company |
|---|---|---|---|
| Anderson Leslie C | -- | -- | |
| Anderson Leslie C | $149,900 | -- | |
| Betton Wilbert Bobby J | $133,500 | -- |
Source: Public Records
Mortgage History
| Date | Status | Borrower | Loan Amount |
|---|---|---|---|
| Open | Anderson Leslie C | $157,377 | |
| Previous Owner | Anderson Leslie C | $119,920 | |
| Closed | Betton Wilbert Bobby J | $0 |
Source: Public Records
Tax History Compared to Growth
Tax History
| Year | Tax Paid | Tax Assessment Tax Assessment Total Assessment is a certain percentage of the fair market value that is determined by local assessors to be the total taxable value of land and additions on the property. | Land | Improvement |
|---|---|---|---|---|
| 2025 | $4,785 | $150,120 | $11,200 | $138,920 |
| 2024 | $4,825 | $142,240 | $11,200 | $131,040 |
| 2023 | $4,825 | $136,920 | $11,200 | $125,720 |
| 2022 | $4,083 | $121,040 | $11,200 | $109,840 |
| 2021 | $2,903 | $86,760 | $11,200 | $75,560 |
| 2020 | $2,965 | $88,400 | $11,200 | $77,200 |
| 2019 | $2,513 | $76,120 | $11,200 | $64,920 |
| 2018 | $1,950 | $61,240 | $11,200 | $50,040 |
| 2017 | $1,907 | $56,400 | $11,200 | $45,200 |
| 2016 | $1,971 | $59,600 | $11,200 | $48,400 |
| 2014 | $1,230 | $38,200 | $11,200 | $27,000 |
Source: Public Records
Map
Nearby Homes
- 3540 Tarragon Dr
- 3433 Hollow Tree Dr
- 4629 Dogwood Farms Dr
- 3417 Hollow Tree Dr
- 4326 Dogwood Farms Dr
- 3688 Eagles Beek Cir
- 4543 Red Tail Dr
- 4461 Dogwood Farms Dr
- 4551 Jackybell Trail
- 3724 Eagles Beek Cir Unit 1
- 4305 Old Lake Dr
- 4210 Pepperdine Dr
- 3666 Stanford Cir
- 4193 Port Chester Way
- 3273 Steeple Dr
- 3778 Berdon Ln
- 4158 Pepperdine Dr
- 3711 Meadow Vista Trail
- 4416 Oakleaf Cove
- 4402 Oakleaf Cove
- 3493 Tarragon Dr
- 3501 Tarragon Dr
- 4422 Oakleaf Cove Unit 1
- 4394 Oakleaf Cove
- 4405 Oakleaf Cove
- 3477 Tarragon Dr
- 3509 Tarragon Dr
- 4395 Oakleaf Cove
- 4417 Oakleaf Cove
- 3461 Tarragon Dr
- 4387 Oakleaf Cove
- 4427 Oakleaf Cove
- 3517 Tarragon Dr
- 4388 Oakleaf Cove
- 3488 Tarragon Dr
- 3478 Tarragon Dr
- 3500 Tarragon Dr
- 3525 Thornwoode Pointe