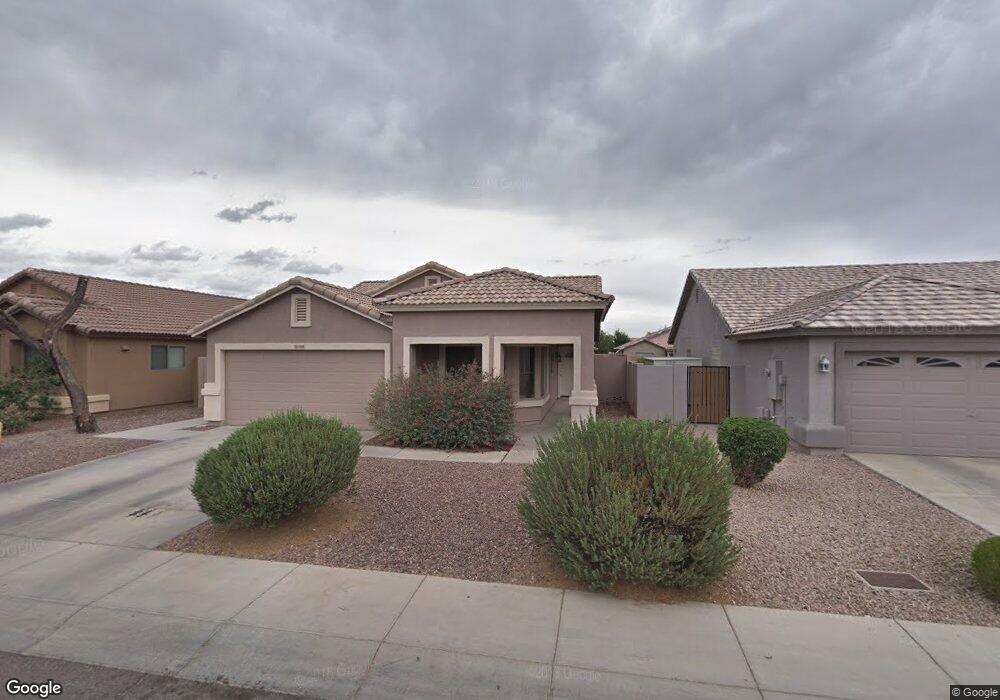
4408 W Ellis St Laveen, AZ 85339
Laveen NeighborhoodEstimated Value: $318,021 - $402,000
--
Bed
2
Baths
1,611
Sq Ft
$230/Sq Ft
Est. Value
About This Home
This home is located at 4408 W Ellis St, Laveen, AZ 85339 and is currently estimated at $371,255, approximately $230 per square foot. 4408 W Ellis St is a home located in Maricopa County with nearby schools including Betty Fairfax High School, Phoenix Coding Academy, and Legacy Traditional School - Laveen Village.
Ownership History
Date
Name
Owned For
Owner Type
Purchase Details
Closed on
Nov 28, 2006
Sold by
Johnson Johnnie and Johnson Sheila
Bought by
Johnson Johnnie C and Johnson Sheila R
Current Estimated Value
Purchase Details
Closed on
Oct 21, 2004
Sold by
York Shaun R and York Sierra R
Bought by
Johnson Johnnie and Johnson Sheila
Home Financials for this Owner
Home Financials are based on the most recent Mortgage that was taken out on this home.
Original Mortgage
$140,800
Outstanding Balance
$69,357
Interest Rate
5.69%
Mortgage Type
New Conventional
Estimated Equity
$301,898
Purchase Details
Closed on
Jun 3, 2003
Sold by
Richmond American Homes Of Arizona Inc
Bought by
York Shaun R and York Sierra R
Home Financials for this Owner
Home Financials are based on the most recent Mortgage that was taken out on this home.
Original Mortgage
$158,649
Interest Rate
5.22%
Mortgage Type
VA
Create a Home Valuation Report for This Property
The Home Valuation Report is an in-depth analysis detailing your home's value as well as a comparison with similar homes in the area
Home Values in the Area
Average Home Value in this Area
Purchase History
| Date | Buyer | Sale Price | Title Company |
|---|---|---|---|
| Johnson Johnnie C | -- | None Available | |
| Johnson Johnnie | $176,000 | First American Title Ins Co | |
| York Shaun R | $155,539 | Fidelity National Title |
Source: Public Records
Mortgage History
| Date | Status | Borrower | Loan Amount |
|---|---|---|---|
| Open | Johnson Johnnie | $140,800 | |
| Previous Owner | York Shaun R | $158,649 |
Source: Public Records
Tax History Compared to Growth
Tax History
| Year | Tax Paid | Tax Assessment Tax Assessment Total Assessment is a certain percentage of the fair market value that is determined by local assessors to be the total taxable value of land and additions on the property. | Land | Improvement |
|---|---|---|---|---|
| 2025 | $1,794 | $11,401 | -- | -- |
| 2024 | $1,726 | $10,858 | -- | -- |
| 2023 | $1,726 | $26,530 | $5,300 | $21,230 |
| 2022 | $1,677 | $19,400 | $3,880 | $15,520 |
| 2021 | $1,677 | $18,130 | $3,620 | $14,510 |
| 2020 | $1,635 | $16,450 | $3,290 | $13,160 |
| 2019 | $1,636 | $14,800 | $2,960 | $11,840 |
| 2018 | $1,562 | $13,570 | $2,710 | $10,860 |
| 2017 | $1,482 | $11,810 | $2,360 | $9,450 |
| 2016 | $1,411 | $10,720 | $2,140 | $8,580 |
| 2015 | $1,273 | $10,160 | $2,030 | $8,130 |
Source: Public Records
Map
Nearby Homes
- 4409 W Dunbar Dr
- 7503 S 45th Dr
- 4315 W Carson Rd
- 4332 W Carson Rd
- 7035 S 43rd Dr
- 4323 W Darrel Rd
- 6915 S 46th Dr
- 4539 W Beautiful Ln
- 4726 W Fremont Rd
- 7904 S 41st Ln
- 4745 W Fremont Rd
- 4335 W Apollo Rd
- 4318 W Apollo Rd
- 4501 W Carter Rd Unit 8
- 4812 W Dunbar Dr
- 4605 W Beverly Rd Unit 2
- 4352 W St Catherine Ave Unit 3
- 7153 S 48th Glen
- 4730 W Fawn Dr
- 8213 S Jenna Ln
- 4412 W Ellis St
- 4402 W Ellis St
- 4416 W Ellis St
- 4409 W Park St
- 4413 W Park St
- 4417 W Park St
- 4420 W Ellis St
- 4411 W Ellis St
- 4407 W Ellis St
- 4421 W Park St
- 4419 W Ellis St
- 4424 W Ellis St
- 4425 W Park St
- 4423 W Ellis St
- 4428 W Ellis St
- 4335 W Park St
- 4410 W Park St
- 4414 W Dunbar Dr
- 4334 W Ellis St
- 4410 W Dunbar Dr