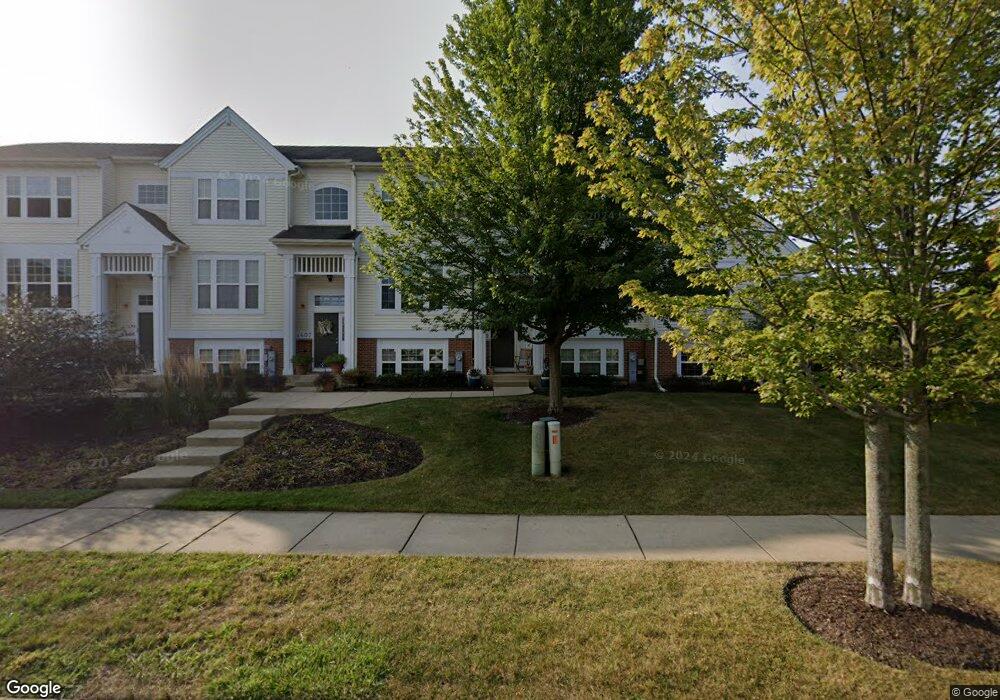
4409 Sawgrass Blvd Unit 133-2 Wadsworth, IL 60083
Estimated Value: $242,000 - $274,666
3
Beds
3
Baths
1,767
Sq Ft
$150/Sq Ft
Est. Value
About This Home
This home is located at 4409 Sawgrass Blvd Unit 133-2, Wadsworth, IL 60083 and is currently estimated at $264,917, approximately $149 per square foot. 4409 Sawgrass Blvd Unit 133-2 is a home located in Lake County with nearby schools including Spaulding Elementary School, Viking Middle School, and Warren Township High School.
Ownership History
Date
Name
Owned For
Owner Type
Purchase Details
Closed on
Mar 31, 2021
Sold by
Taylor Tanimy
Bought by
Taylor Tammy and Jackson Lionel B
Current Estimated Value
Home Financials for this Owner
Home Financials are based on the most recent Mortgage that was taken out on this home.
Original Mortgage
$160,250
Outstanding Balance
$144,917
Interest Rate
3.1%
Mortgage Type
VA
Estimated Equity
$120,000
Purchase Details
Closed on
Oct 10, 2019
Sold by
Johnson Lael
Bought by
Taylor Tammy
Home Financials for this Owner
Home Financials are based on the most recent Mortgage that was taken out on this home.
Original Mortgage
$162,000
Interest Rate
3.5%
Mortgage Type
VA
Purchase Details
Closed on
Apr 1, 2010
Sold by
Centex Homes
Bought by
Johnson Lael
Home Financials for this Owner
Home Financials are based on the most recent Mortgage that was taken out on this home.
Original Mortgage
$158,332
Interest Rate
5.12%
Mortgage Type
VA
Create a Home Valuation Report for This Property
The Home Valuation Report is an in-depth analysis detailing your home's value as well as a comparison with similar homes in the area
Home Values in the Area
Average Home Value in this Area
Purchase History
| Date | Buyer | Sale Price | Title Company |
|---|---|---|---|
| Taylor Tammy | -- | Precision Title | |
| Taylor Tammy | $162,000 | Near North Title Group | |
| Johnson Lael | $155,000 | None Available |
Source: Public Records
Mortgage History
| Date | Status | Borrower | Loan Amount |
|---|---|---|---|
| Open | Taylor Tammy | $160,250 | |
| Closed | Taylor Tammy | $162,000 | |
| Previous Owner | Johnson Lael | $158,332 |
Source: Public Records
Tax History Compared to Growth
Tax History
| Year | Tax Paid | Tax Assessment Tax Assessment Total Assessment is a certain percentage of the fair market value that is determined by local assessors to be the total taxable value of land and additions on the property. | Land | Improvement |
|---|---|---|---|---|
| 2024 | -- | $70,568 | $10,262 | $60,306 |
| 2023 | -- | $63,607 | $9,249 | $54,358 |
| 2022 | $0 | $59,219 | $7,457 | $51,762 |
| 2021 | $0 | $56,843 | $7,158 | $49,685 |
| 2020 | $4,895 | $55,446 | $6,982 | $48,464 |
| 2019 | $4,890 | $53,836 | $6,779 | $47,057 |
| 2018 | $5,536 | $49,187 | $4,931 | $44,256 |
| 2017 | $5,487 | $47,778 | $4,790 | $42,988 |
| 2016 | $5,319 | $45,651 | $4,577 | $41,074 |
| 2015 | $5,239 | $43,296 | $4,341 | $38,955 |
| 2014 | $4,901 | $38,403 | $4,281 | $34,122 |
| 2012 | $5,400 | $42,327 | $4,654 | $37,673 |
Source: Public Records
Map
Nearby Homes
- 3077 Nicklaus Ln Unit 4
- 3015 Monterey Ln
- 4584 Hogan Ln Unit 1404
- 5046 Nelson Ct
- 3006 Concord Ln Unit 1217
- 3123 Concord Ln
- 3111 Mini Dr
- 4171 Midlane Dr
- 37371 N Shirley Dr
- 4747 W Pebble Beach Dr
- 3270 Cashmore Rd
- 4750 Crest Ct
- 3163 N Augusta Dr
- 4827 W Pebble Beach Dr
- 3175 N Magnolia Ln
- 38148 N Helena Ln
- 2625 Shirley Dr Unit H1
- 4837 Dorothy Ct
- 36847 N Delany Rd
- 13377 W Blanchard Rd
- 4409 Sawgrass Blvd
- 4407 Sawgrass Blvd
- 4411 Sawgrass Blvd Unit 133-1
- 4405 Sawgrass Blvd
- 4403 Sawgrass Blvd
- 4401 Sawgrass Blvd Unit 1
- 3081 Nicklaus Ln Unit 2
- 3079 Nicklaus Ln
- 3083 Nicklaus Ln Unit 1
- 3075 Nicklaus Ln Unit 5
- 3073 Nicklaus Ln
- 3073 Nicklaus Ln Unit 1326
- 2229 Newport Ln
- 2380 Newport Ln
- 2760 Newport Ln
- 2528 Newport Ln
- 3100 Newport Ln
- 3074 Nicklaus Ln Unit 1353
- 3103 Newport Ln
- 3028 Monterey Ln