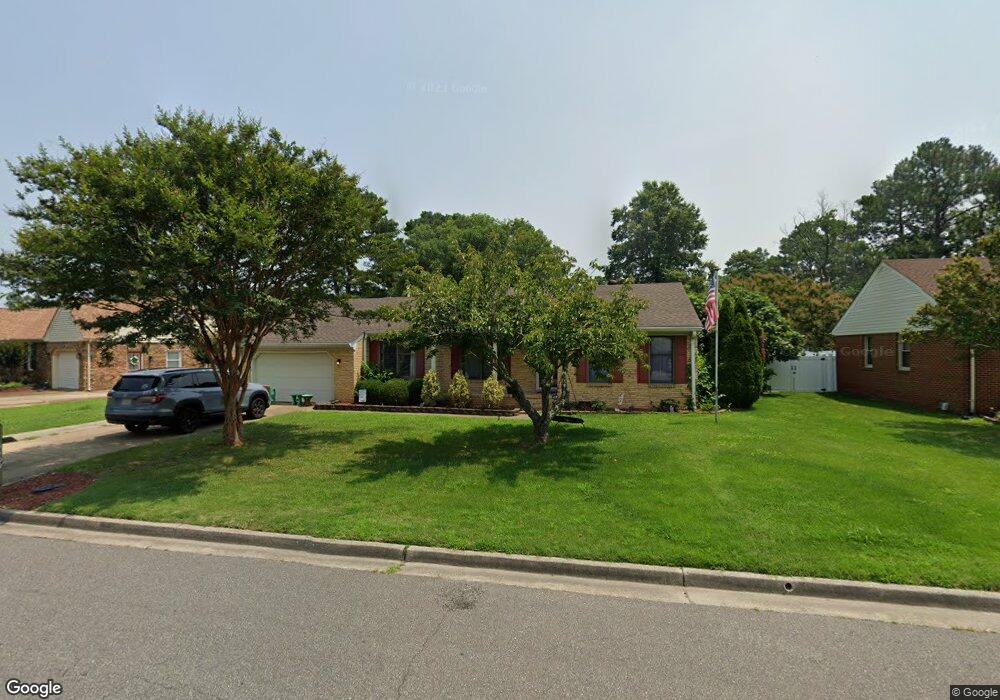
4409 Schoolhouse Path Portsmouth, VA 23703
Churchland NeighborhoodEstimated Value: $373,000 - $416,000
3
Beds
2
Baths
1,800
Sq Ft
$221/Sq Ft
Est. Value
About This Home
This home is located at 4409 Schoolhouse Path, Portsmouth, VA 23703 and is currently estimated at $397,242, approximately $220 per square foot. 4409 Schoolhouse Path is a home located in Portsmouth City with nearby schools including Churchland Primary/Intermediate School, Churchland Middle School, and Churchland High School.
Ownership History
Date
Name
Owned For
Owner Type
Purchase Details
Closed on
Mar 19, 2020
Sold by
Thompson Daniel Lee
Bought by
Erskine Quenten and Erskine Amanda
Current Estimated Value
Home Financials for this Owner
Home Financials are based on the most recent Mortgage that was taken out on this home.
Original Mortgage
$260,865
Outstanding Balance
$230,089
Interest Rate
3.4%
Mortgage Type
VA
Estimated Equity
$167,153
Purchase Details
Closed on
Jun 30, 2017
Sold by
Ball Julie A
Bought by
Thompson Daniel Lee
Home Financials for this Owner
Home Financials are based on the most recent Mortgage that was taken out on this home.
Original Mortgage
$201,235
Interest Rate
3.9%
Mortgage Type
VA
Purchase Details
Closed on
Nov 24, 2014
Sold by
Zerillo Trustee Joseph
Bought by
Thomas Julie A
Create a Home Valuation Report for This Property
The Home Valuation Report is an in-depth analysis detailing your home's value as well as a comparison with similar homes in the area
Home Values in the Area
Average Home Value in this Area
Purchase History
| Date | Buyer | Sale Price | Title Company |
|---|---|---|---|
| Erskine Quenten | $255,000 | Navy Federal Title Svcs Llc | |
| Thompson Daniel Lee | $197,000 | Select Settlement Group Inc | |
| Thomas Julie A | -- | -- |
Source: Public Records
Mortgage History
| Date | Status | Borrower | Loan Amount |
|---|---|---|---|
| Open | Erskine Quenten | $260,865 | |
| Previous Owner | Thompson Daniel Lee | $201,235 |
Source: Public Records
Tax History Compared to Growth
Tax History
| Year | Tax Paid | Tax Assessment Tax Assessment Total Assessment is a certain percentage of the fair market value that is determined by local assessors to be the total taxable value of land and additions on the property. | Land | Improvement |
|---|---|---|---|---|
| 2025 | $4,474 | $354,870 | $99,000 | $255,870 |
| 2024 | $4,474 | $349,820 | $99,000 | $250,820 |
| 2023 | $4,195 | $321,880 | $99,000 | $222,880 |
| 2022 | $3,729 | $286,870 | $82,500 | $204,370 |
| 2021 | $3,376 | $259,710 | $55,340 | $204,370 |
| 2020 | $3,342 | $257,080 | $52,710 | $204,370 |
| 2019 | $3,189 | $245,310 | $52,710 | $192,600 |
| 2018 | $3,189 | $245,310 | $52,710 | $192,600 |
| 2017 | $3,189 | $245,310 | $52,710 | $192,600 |
| 2016 | $3,189 | $245,310 | $52,710 | $192,600 |
| 2015 | $3,082 | $237,060 | $52,710 | $184,350 |
| 2014 | $3,011 | $237,060 | $52,710 | $184,350 |
Source: Public Records
Map
Nearby Homes
- 5728 Hawthorne Ln
- 4444 Southampton Arch
- 5833 Hawthorne Ln
- 4232 Summerset Dr
- 4224 Burnham Dr
- 5693 Rivermill Cir
- 5606 Gregory Ct
- 21 Windy Pines Crescent
- 4619 River Shore Rd
- 4200 Quince Rd
- 4028 Swannanoa Dr
- 4726 River Shore Rd
- 8 Compass Ct
- 4100 Mayfair Way
- 5807 Dunkin St
- 17 Shoal Ct
- 4071 Long Point Blvd
- 3433 Willow Breeze Dr
- 4008 Oakhurst Rd
- 6750 Burbage Landing Cir
- 4405 Schoolhouse Path
- 4408 Schoolhouse Path
- 4408 Birch Rd
- 4404 Schoolhouse Path
- 4412 Schoolhouse Path
- 4417 Schoolhouse Path
- 4404 Birch Rd
- 4412 Birch Rd
- 4401 Schoolhouse Path
- 4416 Schoolhouse Path
- 4400 Birch Rd
- 4400 Schoolhouse Path
- 4418 Birch Rd
- 5808 Hedgerow Ln
- 4420 Schoolhouse Path
- 5824 Hedgerow Cir
- 4424 Birch Rd
- 5820 Hedgerow Cir
- 4419 S Highgate Cir
- 4419 Highgate Cir S