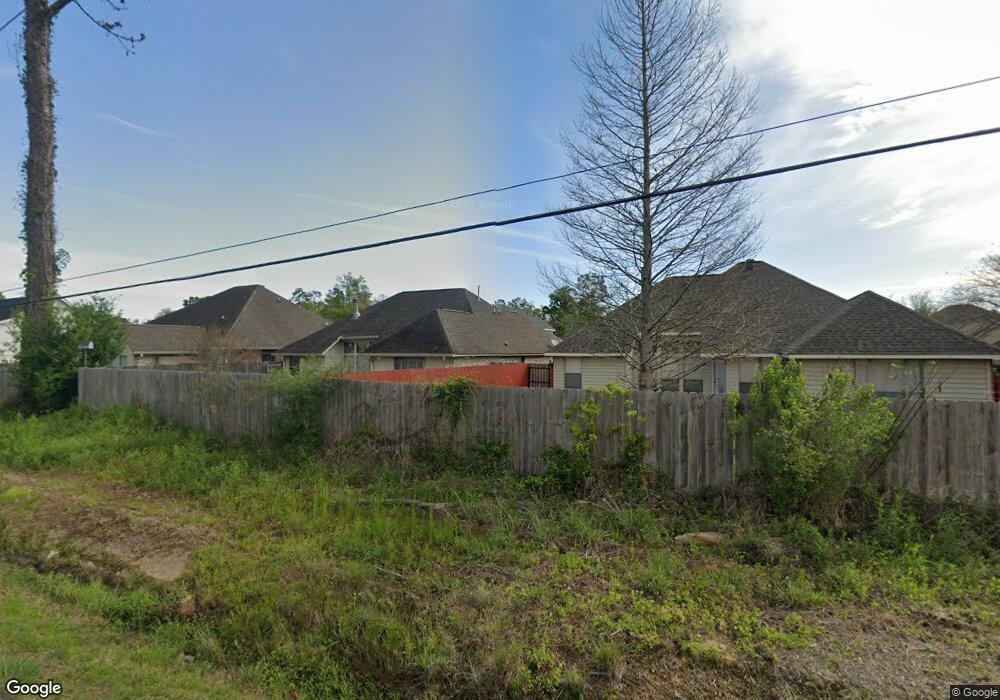
44094 High Oats Trail Hammond, LA 70403
Estimated Value: $256,546 - $394,000
--
Bed
--
Bath
3,091
Sq Ft
$104/Sq Ft
Est. Value
About This Home
This home is located at 44094 High Oats Trail, Hammond, LA 70403 and is currently estimated at $321,887, approximately $104 per square foot. 44094 High Oats Trail is a home located in Tangipahoa Parish with nearby schools including Woodland Park Magnet, Hammond High Magnet School, and Tangi Academy.
Ownership History
Date
Name
Owned For
Owner Type
Purchase Details
Closed on
Jul 8, 2024
Sold by
Vicknair Dwayne Thomas and Vicknair Mikki Stephens
Bought by
Diekmann Indigo Kate
Current Estimated Value
Home Financials for this Owner
Home Financials are based on the most recent Mortgage that was taken out on this home.
Original Mortgage
$358,388
Outstanding Balance
$353,744
Interest Rate
6.94%
Mortgage Type
FHA
Estimated Equity
-$31,857
Purchase Details
Closed on
Oct 4, 2021
Sold by
F5 Holdings Llc
Bought by
Vicknair Dwayne T and Vicknair Mikki S
Purchase Details
Closed on
Apr 22, 2005
Sold by
Forbes Farm Llc
Bought by
Vicknair Dwayne Thomas
Home Financials for this Owner
Home Financials are based on the most recent Mortgage that was taken out on this home.
Original Mortgage
$32,250
Interest Rate
5.89%
Mortgage Type
Future Advance Clause Open End Mortgage
Create a Home Valuation Report for This Property
The Home Valuation Report is an in-depth analysis detailing your home's value as well as a comparison with similar homes in the area
Home Values in the Area
Average Home Value in this Area
Purchase History
| Date | Buyer | Sale Price | Title Company |
|---|---|---|---|
| Diekmann Indigo Kate | $365,000 | Crescent Title | |
| Vicknair Dwayne T | $180,000 | None Available | |
| Vicknair Dwayne Thomas | $33,250 | None Available |
Source: Public Records
Mortgage History
| Date | Status | Borrower | Loan Amount |
|---|---|---|---|
| Open | Diekmann Indigo Kate | $358,388 | |
| Previous Owner | Vicknair Dwayne Thomas | $32,250 |
Source: Public Records
Tax History Compared to Growth
Tax History
| Year | Tax Paid | Tax Assessment Tax Assessment Total Assessment is a certain percentage of the fair market value that is determined by local assessors to be the total taxable value of land and additions on the property. | Land | Improvement |
|---|---|---|---|---|
| 2024 | $1,859 | $22,454 | $2,700 | $19,754 |
| 2023 | $1,877 | $22,456 | $2,500 | $19,956 |
| 2022 | $1,877 | $22,456 | $2,500 | $19,956 |
| 2021 | $1,728 | $22,456 | $2,500 | $19,956 |
| 2020 | $2,349 | $22,456 | $2,500 | $19,956 |
| 2019 | $2,342 | $22,456 | $2,500 | $19,956 |
| 2018 | $2,349 | $22,456 | $2,500 | $19,956 |
| 2017 | $2,349 | $22,456 | $2,500 | $19,956 |
| 2016 | $2,349 | $22,456 | $2,500 | $19,956 |
| 2015 | $1,251 | $22,456 | $2,500 | $19,956 |
| 2014 | $1,192 | $22,456 | $2,500 | $19,956 |
Source: Public Records
Map
Nearby Homes
- 44083 High Oats Trail
- 17252 English Saddle Ln
- 17198 Bridle Path
- 17198 Bridle Path None
- 17314 Paddock Cir
- 17310 Paddock Cir
- 44018 Easy St
- 44035 Sweet William Dr
- 17253 Churchill Dr
- 43484 Springwood Way
- 44111 Covington Ridge Dr
- 43448 Springwood Way
- 17351 Old Covington Hwy
- 44299 Country Creek Ln Unit LOT 8
- 44299 Country Creek Ln Unit 10
- 0 Simpson Place
- 44154 Simpson Place
- 17063 E Park Ave
- 44176 Simpson Place
- 17145 Bridle Path
- 17145 Bridle Path None
- 44105 Forbes Farm Dr
- 44095 Forbes Farm Dr
- 44089 High Oats Trail
- 44089 High Oats Trail Other
- 44089 High Oats Trail
- 44113 Forbes Farm Dr
- 17151 Bridle Path
- 44095 High Oats Trail
- 44095 High Oat Trail Other
- 44075 Forbes Farm Dr
- 44076 High Oats Trail
- 0 Forbes Farm St
- 44077 High Oats Trail None
- 44077 High Oats Trail
- 44077 High Oats Trail Other
- 44101 High Oats Trail
- 17157 Bridle Path None
- 17157 Bridle Path Other