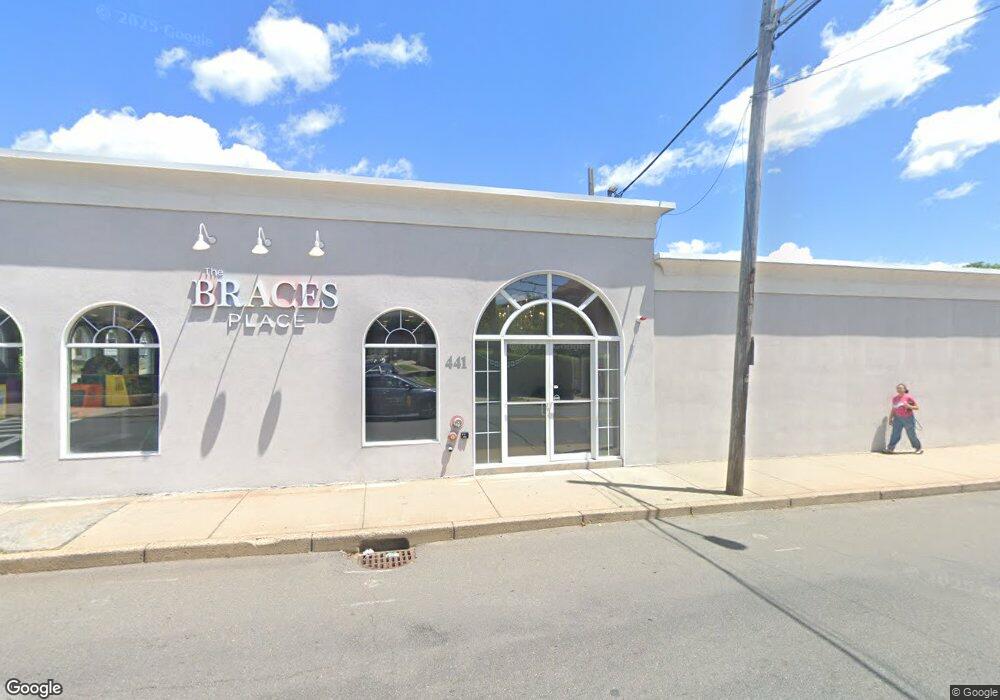
441 Chatham St Lynn, MA 01902
Chatham Street NeighborhoodEstimated Value: $1,907,953
Studio
--
Bath
14,355
Sq Ft
$133/Sq Ft
Est. Value
About This Home
This home is located at 441 Chatham St, Lynn, MA 01902 and is currently estimated at $1,907,953, approximately $132 per square foot. 441 Chatham St is a home located in Essex County with nearby schools including Hood Elementary School, William R. Fallon School, and Marshall Middle School.
Ownership History
Date
Name
Owned For
Owner Type
Purchase Details
Closed on
Mar 17, 2017
Sold by
Chatham Street Llc
Bought by
Lacourt Holdings Llc
Current Estimated Value
Home Financials for this Owner
Home Financials are based on the most recent Mortgage that was taken out on this home.
Original Mortgage
$825,000
Outstanding Balance
$681,229
Interest Rate
4.19%
Mortgage Type
Commercial
Estimated Equity
$1,226,724
Purchase Details
Closed on
Sep 1, 1999
Sold by
Maltais Rt and Malatais William
Bought by
Chatham Street Llc and Diamico Alphonse A
Home Financials for this Owner
Home Financials are based on the most recent Mortgage that was taken out on this home.
Original Mortgage
$185,000
Interest Rate
7.5%
Mortgage Type
Commercial
Create a Home Valuation Report for This Property
The Home Valuation Report is an in-depth analysis detailing your home's value as well as a comparison with similar homes in the area
Home Values in the Area
Average Home Value in this Area
Purchase History
| Date | Buyer | Sale Price | Title Company |
|---|---|---|---|
| Lacourt Holdings Llc | $1,100,000 | -- | |
| Chatham Street Llc | $250,000 | -- | |
| Chatham Street Llc | $250,000 | -- |
Source: Public Records
Mortgage History
| Date | Status | Borrower | Loan Amount |
|---|---|---|---|
| Open | Lacourt Holdings Llc | $825,000 | |
| Closed | Lacourt Holdings Llc | $825,000 | |
| Previous Owner | Chatham Street Llc | $185,000 |
Source: Public Records
Tax History
| Year | Tax Paid | Tax Assessment Tax Assessment Total Assessment is a certain percentage of the fair market value that is determined by local assessors to be the total taxable value of land and additions on the property. | Land | Improvement |
|---|---|---|---|---|
| 2025 | $36,467 | $1,836,200 | $352,000 | $1,484,200 |
| 2024 | $35,307 | $1,749,600 | $335,900 | $1,413,700 |
| 2023 | $33,212 | $1,555,600 | $309,500 | $1,246,100 |
| 2022 | $30,462 | $1,285,300 | $262,100 | $1,023,200 |
| 2021 | $32,158 | $1,285,300 | $262,100 | $1,023,200 |
| 2020 | $33,142 | $1,281,100 | $262,100 | $1,019,000 |
| 2019 | $31,694 | $1,147,900 | $224,200 | $923,700 |
| 2018 | $15,373 | $522,000 | $212,100 | $309,900 |
| 2017 | $15,688 | $511,500 | $212,100 | $299,400 |
| 2016 | $15,790 | $492,500 | $204,000 | $288,500 |
| 2015 | $16,538 | $492,500 | $204,000 | $288,500 |
Source: Public Records
Map
Nearby Homes
- 439 Chatham St
- 435 Chatham St
- 76 Haviland Ave
- 14 Lee Ct
- 431-433 Chatham St Unit 1
- 16 Lee Ct
- 72 Haviland Ave
- 83 Haviland Ave
- 451 Chatham St
- 79 Haviland Ave
- 18 Lee Ct
- 427 Chatham St
- 427 Chatham St Unit 2
- 11 Lee Ct
- 68 Haviland Ave
- 424 Chatham St
- 20 Lee Ct
- 422 Chatham St
- 75 Haviland Ave
- 75 Haviland Ave Unit 3
Your Personal Tour Guide
Ask me questions while you tour the home.