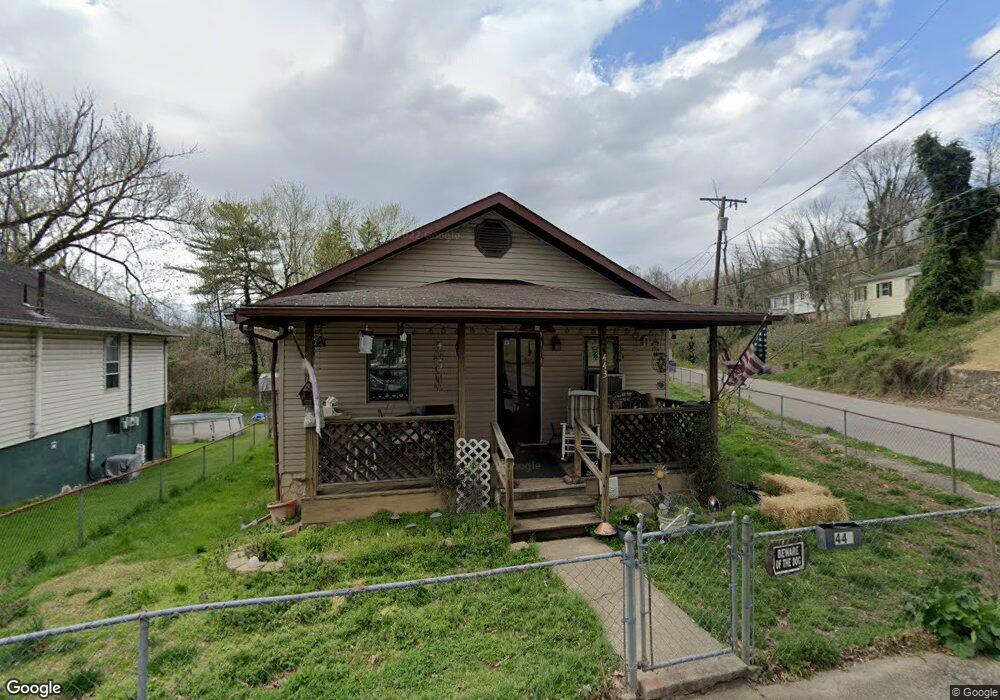
441 Corbin Ct Dunbar, WV 25064
Estimated Value: $99,000 - $118,000
2
Beds
1
Bath
984
Sq Ft
$108/Sq Ft
Est. Value
About This Home
This home is located at 441 Corbin Ct, Dunbar, WV 25064 and is currently estimated at $106,599, approximately $108 per square foot. 441 Corbin Ct is a home located in Kanawha County with nearby schools including Dunbar Intermediate Center, Dunbar Primary Center, and William J. Raglin Center.
Ownership History
Date
Name
Owned For
Owner Type
Purchase Details
Closed on
Aug 13, 2004
Sold by
Milano Jennifer
Bought by
Davis Jennie
Current Estimated Value
Home Financials for this Owner
Home Financials are based on the most recent Mortgage that was taken out on this home.
Original Mortgage
$52,250
Outstanding Balance
$25,945
Interest Rate
6.02%
Mortgage Type
New Conventional
Estimated Equity
$80,654
Purchase Details
Closed on
Nov 19, 2002
Sold by
Chestnut Ridge
Bought by
Snuffer David
Create a Home Valuation Report for This Property
The Home Valuation Report is an in-depth analysis detailing your home's value as well as a comparison with similar homes in the area
Home Values in the Area
Average Home Value in this Area
Purchase History
| Date | Buyer | Sale Price | Title Company |
|---|---|---|---|
| Davis Jennie | $55,000 | -- | |
| Snuffer David | $50,000 | -- |
Source: Public Records
Mortgage History
| Date | Status | Borrower | Loan Amount |
|---|---|---|---|
| Open | Davis Jennie | $52,250 |
Source: Public Records
Tax History Compared to Growth
Tax History
| Year | Tax Paid | Tax Assessment Tax Assessment Total Assessment is a certain percentage of the fair market value that is determined by local assessors to be the total taxable value of land and additions on the property. | Land | Improvement |
|---|---|---|---|---|
| 2024 | $678 | $41,460 | $11,100 | $30,360 |
| 2023 | $652 | $39,900 | $11,100 | $28,800 |
| 2022 | $652 | $39,900 | $11,100 | $28,800 |
| 2021 | $615 | $37,620 | $11,100 | $26,520 |
| 2020 | $615 | $37,620 | $11,100 | $26,520 |
| 2019 | $615 | $37,620 | $11,100 | $26,520 |
| 2018 | $562 | $37,620 | $11,100 | $26,520 |
| 2017 | $563 | $37,620 | $11,100 | $26,520 |
| 2016 | $564 | $37,620 | $11,100 | $26,520 |
| 2015 | $562 | $37,620 | $11,100 | $26,520 |
| 2014 | $546 | $37,200 | $11,100 | $26,100 |
Source: Public Records
Map
Nearby Homes