Estimated Value: $435,000 - $570,000
3
Beds
2
Baths
1,648
Sq Ft
$295/Sq Ft
Est. Value
About This Home
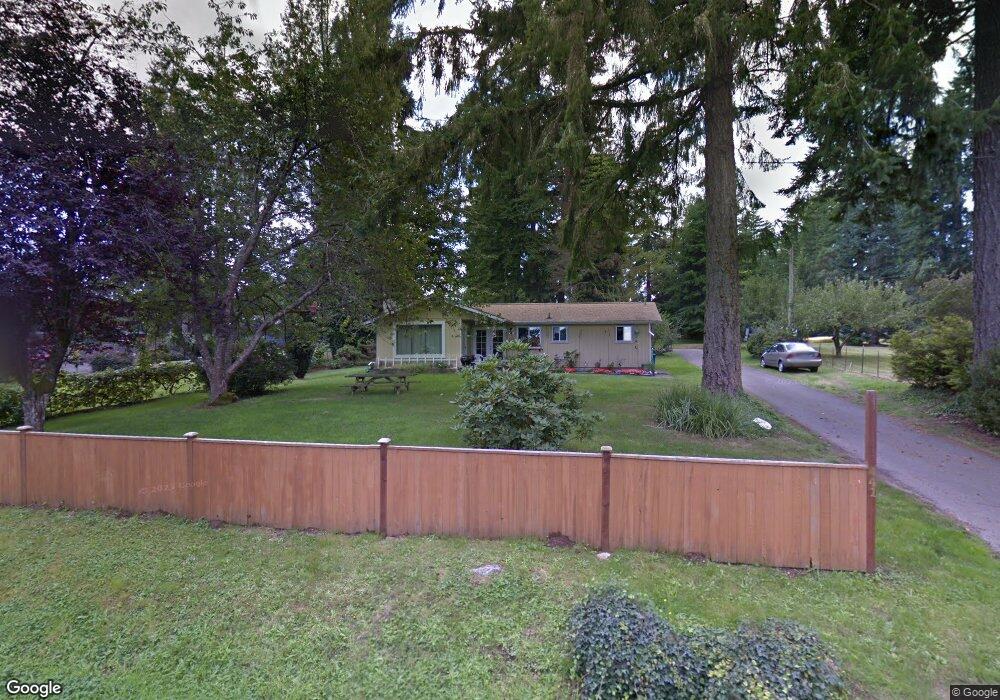
This home is located at 441 E Cronquist Rd, Allyn, WA 98524 and is currently estimated at $486,970, approximately $295 per square foot. 441 E Cronquist Rd is a home located in Mason County with nearby schools including Grapeview Elementary/Middle School.
Ownership History
Date
Name
Owned For
Owner Type
Purchase Details
Closed on
Jun 2, 2018
Sold by
Farster Christal L and Farster Christal L
Bought by
Farster Christal L and Dunn Lykendrick
Current Estimated Value
Home Financials for this Owner
Home Financials are based on the most recent Mortgage that was taken out on this home.
Original Mortgage
$171,957
Outstanding Balance
$151,892
Interest Rate
5.5%
Mortgage Type
FHA
Estimated Equity
$335,078
Purchase Details
Closed on
Nov 12, 2008
Sold by
Farster Robert N and Farster Barbara J
Bought by
Farster Christal L
Home Financials for this Owner
Home Financials are based on the most recent Mortgage that was taken out on this home.
Original Mortgage
$134,055
Interest Rate
6.07%
Mortgage Type
FHA
Purchase Details
Closed on
May 18, 2006
Sold by
Leebrick Donald J and Fudell Iris Ann
Bought by
Farster Robert and Farster Barbara
Create a Home Valuation Report for This Property
The Home Valuation Report is an in-depth analysis detailing your home's value as well as a comparison with similar homes in the area
Purchase History
| Date | Buyer | Sale Price | Title Company |
|---|---|---|---|
| Farster Christal L | -- | None Available | |
| Farster Christal L | $131,750 | Land Title Co | |
| Farster Christal L | -- | Land Title Co | |
| Farster Robert | $100,000 | Land Title Co |
Source: Public Records
Mortgage History
| Date | Status | Borrower | Loan Amount |
|---|---|---|---|
| Open | Farster Christal L | $171,957 | |
| Closed | Farster Christal L | $134,055 |
Source: Public Records
Tax History
| Year | Tax Paid | Tax Assessment Tax Assessment Total Assessment is a certain percentage of the fair market value that is determined by local assessors to be the total taxable value of land and additions on the property. | Land | Improvement |
|---|---|---|---|---|
| 2025 | $3,255 | $433,750 | $92,800 | $340,950 |
| 2023 | $3,255 | $383,755 | $91,410 | $292,345 |
| 2022 | $2,862 | $323,735 | $59,030 | $264,705 |
| 2021 | $2,493 | $323,735 | $59,030 | $264,705 |
| 2020 | $2,200 | $280,880 | $45,410 | $235,470 |
| 2018 | $1,571 | $143,405 | $34,550 | $108,855 |
| 2017 | $1,361 | $143,265 | $34,410 | $108,855 |
| 2016 | $1,304 | $131,730 | $32,770 | $98,960 |
| 2015 | $1,297 | $125,910 | $38,745 | $87,165 |
| 2014 | -- | $120,300 | $34,650 | $85,650 |
| 2013 | -- | $110,945 | $29,925 | $81,020 |
Source: Public Records
Map
Nearby Homes
- 5440 E Grapeview Loop Rd
- 90 E Treasure Island Dr
- 7104 E Grapeview Loop Rd
- 7360 E Grapeview Loop Rd
- 17717 E State Route 3
- 17991 E State Route 3
- 116th 166th St NW
- 61 E Channel Dr
- 41 E Westlake Place
- 11515 189th Ave NW Unit Lot 2
- 11515 189th Ave NW
- 18909 115th St NW
- 0 E Wheelwright St S
- 40 E Lakeshore Dr
- 170 E Lakeland Dr
- 11 E Eberhart Ln
- 71 E Sullivan St
- 101 E Pirates Place
- 453 E Victor Rd
- 31 E Village View Dr
- 411 E Cronquist Rd
- 391 E Cronquist Rd
- 461 Cronquist Rd
- 420 E Cronquist Rd
- 371 E Cronquist Rd Unit A
- 371 E Cronquist Rd
- 491 E Cronquist Rd
- 321 E Cronquist Rd
- 511 E Cronquist Rd
- 422 E Cronquist Rd
- 400 E Cronquist Rd
- 390 E Cronquist Rd
- 424 E Cronquist Rd
- 380 E Cronquist Rd
- 502 E Cronquist Rd
- 521 E Cronquist Rd
- 370 E Cronquist Rd
- 500 E Cronquist Rd
- 551 Cronquist Rd
- 330 E Cronquist Rd
Your Personal Tour Guide
Ask me questions while you tour the home.