Estimated Value: $621,000 - $715,000
2
Beds
1
Bath
816
Sq Ft
$812/Sq Ft
Est. Value
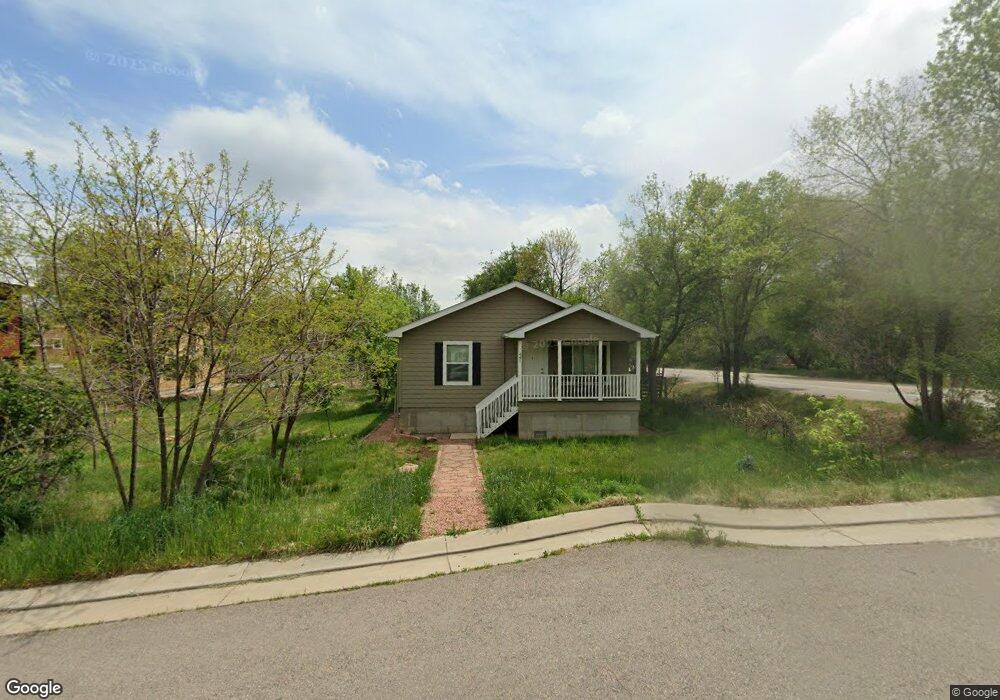
About This Home
This home is located at 441 Evans St, Lyons, CO 80540 and is currently estimated at $662,846, approximately $812 per square foot. 441 Evans St is a home located in Boulder County with nearby schools including Lyons Elementary School and Lyons Middle/Senior High School.
Ownership History
Date
Name
Owned For
Owner Type
Purchase Details
Closed on
Dec 24, 2010
Sold by
Wolff Mark S and Wang Katherine T
Bought by
Wolff Mark S
Current Estimated Value
Home Financials for this Owner
Home Financials are based on the most recent Mortgage that was taken out on this home.
Original Mortgage
$119,048
Outstanding Balance
$81,868
Interest Rate
5.04%
Mortgage Type
New Conventional
Estimated Equity
$580,978
Purchase Details
Closed on
May 14, 1999
Sold by
Thoe Lyndon J and Thoe Diane M
Bought by
Wolff Mark S
Home Financials for this Owner
Home Financials are based on the most recent Mortgage that was taken out on this home.
Original Mortgage
$130,500
Interest Rate
7.04%
Purchase Details
Closed on
Jan 13, 1998
Sold by
Thoe Lyndon J and Thoe Diane M
Bought by
Thoe Lyndon J
Purchase Details
Closed on
Oct 8, 1993
Sold by
Orendorff Zella A and Orendorff Daniel L
Bought by
Thoe Lyndon J
Purchase Details
Closed on
Jul 2, 1985
Bought by
Wolff Mark S and Wang Katherine T
Create a Home Valuation Report for This Property
The Home Valuation Report is an in-depth analysis detailing your home's value as well as a comparison with similar homes in the area
Purchase History
| Date | Buyer | Sale Price | Title Company |
|---|---|---|---|
| Wolff Mark S | -- | First American | |
| Wolff Mark S | $145,000 | First American Heritage Titl | |
| Thoe Lyndon J | -- | -- | |
| Thoe Lyndon J | $77,300 | -- | |
| Wolff Mark S | $49,900 | -- |
Source: Public Records
Mortgage History
| Date | Status | Borrower | Loan Amount |
|---|---|---|---|
| Open | Wolff Mark S | $119,048 | |
| Closed | Wolff Mark S | $130,500 | |
| Closed | Thoe Lyndon J | -- |
Source: Public Records
Tax History
| Year | Tax Paid | Tax Assessment Tax Assessment Total Assessment is a certain percentage of the fair market value that is determined by local assessors to be the total taxable value of land and additions on the property. | Land | Improvement |
|---|---|---|---|---|
| 2025 | $5,032 | $40,282 | $3,719 | $36,563 |
| 2024 | $5,032 | $40,282 | $3,719 | $36,563 |
| 2023 | $4,964 | $42,311 | $3,544 | $42,451 |
| 2022 | $4,304 | $34,910 | $3,267 | $31,643 |
| 2021 | $4,252 | $35,915 | $3,361 | $32,554 |
| 2020 | $3,581 | $29,966 | $8,580 | $21,386 |
| 2019 | $3,509 | $29,966 | $8,580 | $21,386 |
| 2018 | $3,074 | $26,770 | $8,928 | $17,842 |
| 2017 | $3,023 | $29,595 | $9,870 | $19,725 |
| 2016 | $351 | $1,759 | $1,759 | $0 |
| 2015 | $194 | $4,243 | $1,759 | $2,484 |
| 2014 | $1,304 | $12,579 | $2,547 | $10,032 |
Source: Public Records
Map
Nearby Homes
- 342 4th Ave
- 17667 Route 7
- 18673 Route 7
- 240 Main St
- 421 Stickney Ave
- 245 High St
- 618 Overlook Dr
- 112 Longs Peak Dr
- 1040 5th Ave 2 and 4
- 1040 5th Ave 5
- 270 County Road 69
- 125 Longs Peak Dr
- 0 Apple Valley Rd
- 104 Noland Ct
- 350 Mcconnell Dr
- 121 Osprey Ln
- 400 Carter Dr
- 334 Mcconnell Dr
- 430 Carter Dr
- 157 Stone Canyon Dr
Your Personal Tour Guide
Ask me questions while you tour the home.