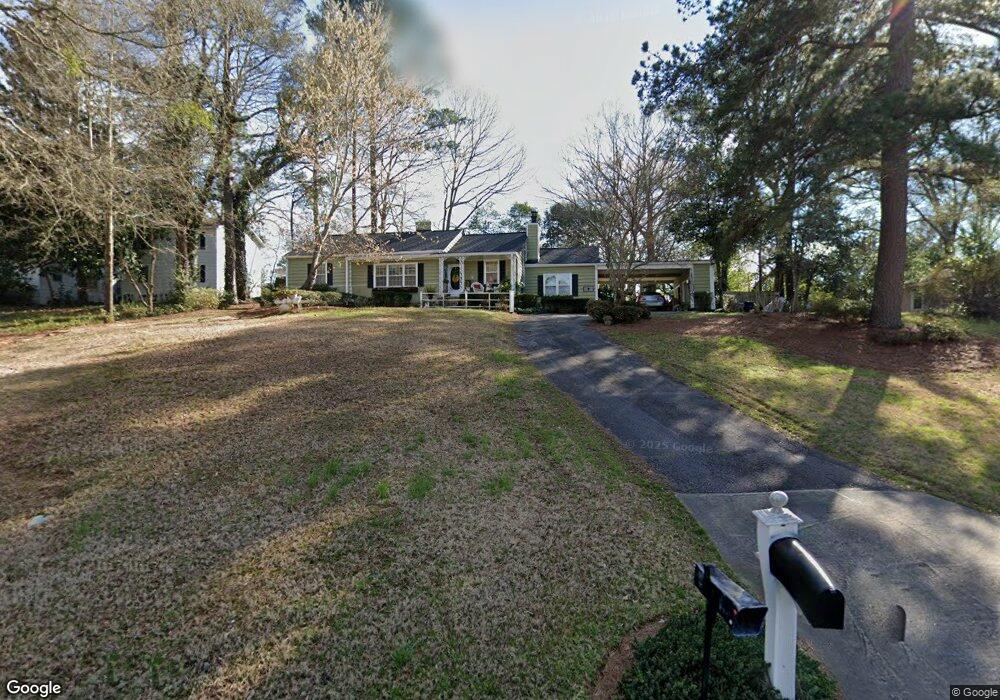
441 Gordon Cir Lagrange, GA 30240
Estimated Value: $227,021 - $284,000
3
Beds
1
Bath
1,695
Sq Ft
$150/Sq Ft
Est. Value
About This Home
This home is located at 441 Gordon Cir, Lagrange, GA 30240 and is currently estimated at $254,755, approximately $150 per square foot. 441 Gordon Cir is a home located in Troup County with nearby schools including Hollis Hand Elementary School, Franklin Forest Elementary School, and Ethel W. Kight Elementary School.
Ownership History
Date
Name
Owned For
Owner Type
Purchase Details
Closed on
Apr 29, 1983
Sold by
Key Robert M and Key Dorothy J
Bought by
Ault Ethyl L
Current Estimated Value
Purchase Details
Closed on
Aug 10, 1981
Sold by
Holle Wm F and Holle Cahterine M
Bought by
Key Robert M and Key Dorothy J
Purchase Details
Closed on
May 23, 1978
Sold by
Williamson Phillip R and Williamson Sonji B
Bought by
Holle Wm F and Holle Cahterine M
Purchase Details
Closed on
Nov 22, 1976
Sold by
Hopkins Walton T and Hopkins Katherine G
Bought by
Williamson Phillip R and Williamson Sonji B
Purchase Details
Closed on
Jan 1, 1972
Sold by
Rackley Thomas and Rackley Brenda
Bought by
Hopkins Walton T and Hopkins Katherine G
Purchase Details
Closed on
Jan 1, 1971
Sold by
Duncan Thurman E
Bought by
Rackley Thomas and Rackley Brenda
Purchase Details
Closed on
Sep 1, 1963
Sold by
Amos J C
Bought by
Duncan Thurman E
Create a Home Valuation Report for This Property
The Home Valuation Report is an in-depth analysis detailing your home's value as well as a comparison with similar homes in the area
Home Values in the Area
Average Home Value in this Area
Purchase History
| Date | Buyer | Sale Price | Title Company |
|---|---|---|---|
| Ault Ethyl L | $35,600 | -- | |
| Key Robert M | $32,400 | -- | |
| Holle Wm F | $40,000 | -- | |
| Williamson Phillip R | $35,000 | -- | |
| Hopkins Walton T | $27,800 | -- | |
| Rackley Thomas | $26,500 | -- | |
| Duncan Thurman E | -- | -- |
Source: Public Records
Tax History Compared to Growth
Tax History
| Year | Tax Paid | Tax Assessment Tax Assessment Total Assessment is a certain percentage of the fair market value that is determined by local assessors to be the total taxable value of land and additions on the property. | Land | Improvement |
|---|---|---|---|---|
| 2024 | $1,843 | $69,560 | $18,000 | $51,560 |
| 2023 | $1,709 | $64,640 | $18,000 | $46,640 |
| 2022 | $1,670 | $61,840 | $18,000 | $43,840 |
| 2021 | $1,475 | $50,880 | $14,000 | $36,880 |
| 2020 | $1,354 | $46,880 | $10,000 | $36,880 |
| 2019 | $1,300 | $45,080 | $10,000 | $35,080 |
| 2018 | $1,250 | $43,440 | $10,000 | $33,440 |
| 2017 | $1,103 | $38,560 | $10,000 | $28,560 |
| 2016 | $1,091 | $38,171 | $10,000 | $28,171 |
| 2015 | $1,093 | $38,171 | $10,000 | $28,171 |
| 2014 | $1,025 | $35,855 | $10,000 | $25,855 |
| 2013 | -- | $38,774 | $10,000 | $28,774 |
Source: Public Records
Map
Nearby Homes
- 105 Saynor Cir
- 408 Gordon St
- 705 Piney Woods Dr
- 609 Cherokee Rd
- 203 Waverly Way
- 110 Waverly Way
- 109 Waverly Way
- 219 Banks St
- 206 Broad St
- 109 Thomas St
- 609 Ridley Ave
- 707 Ridley Ave
- 611 Ridley Ave
- 615 Ridley Ave
- 709 Ridley Ave
- 0 Ridley Ave Unit 10550104
- 748 Lakewood Dr
- 145 Turner St
- 209 Boulevard
- 208 Boulevard
- 443 Gordon Cir
- 443 Gordon Cir
- 119 Dilly Hill
- 117 Dilly Hill
- 433 Gordon Cir
- 121 Dilly Hill
- 123 Dilly Hill
- 445 Gordon Cir
- 442 Gordon Cir
- 442 Gordon Cir
- 0 Gordon Cir Unit 7609789
- 0 Gordon Cir Unit 3241060
- 0 Gordon Cir Unit 7191898
- 0 Gordon Cir Unit 9020646
- 0 Gordon Cir Unit 3118962
- 0 Gordon Cir Unit 3132902
- 0 Gordon Cir Unit 7168384
- 0 Gordon Cir Unit 7238856
- 0 Gordon Cir Unit 8226063
- 0 Gordon Cir Unit 8296490