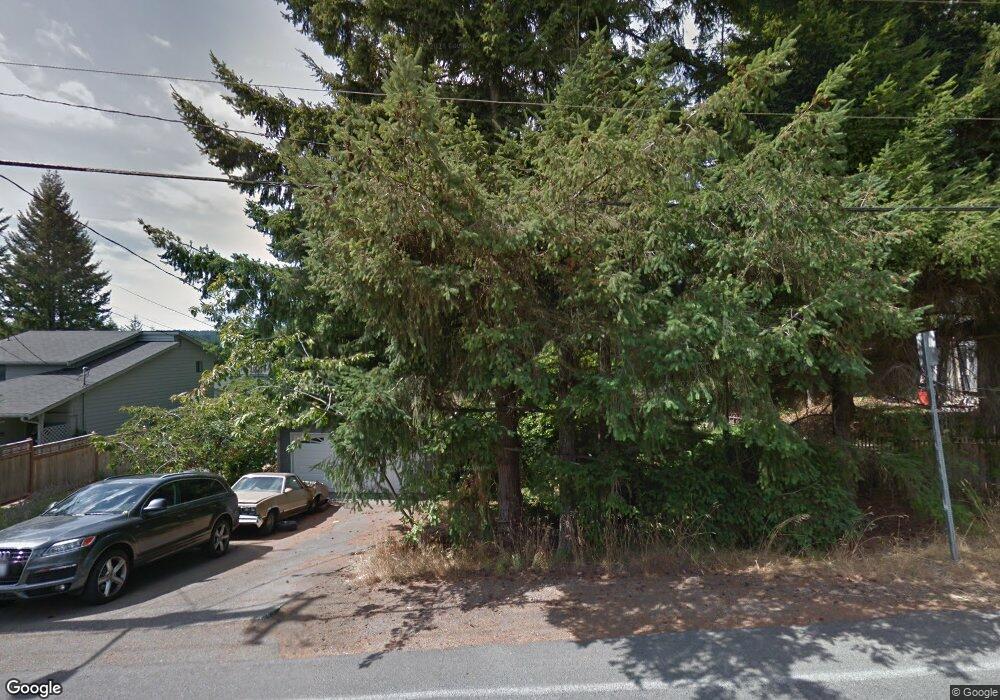
441 Grow Ave NW Bainbridge Island, WA 98110
Estimated Value: $788,000 - $942,000
3
Beds
2
Baths
1,344
Sq Ft
$651/Sq Ft
Est. Value
About This Home
This home is located at 441 Grow Ave NW, Bainbridge Island, WA 98110 and is currently estimated at $875,511, approximately $651 per square foot. 441 Grow Ave NW is a home located in Kitsap County with nearby schools including Bainbridge High School, Madrona School, and St. Cecilia Catholic School.
Ownership History
Date
Name
Owned For
Owner Type
Purchase Details
Closed on
Feb 9, 2021
Sold by
Woo Alice Fea Wan
Bought by
Ybarra Bradley S
Current Estimated Value
Purchase Details
Closed on
Jun 2, 1999
Sold by
Covert Dana T
Bought by
Woo Alice F
Home Financials for this Owner
Home Financials are based on the most recent Mortgage that was taken out on this home.
Original Mortgage
$114,380
Interest Rate
6.75%
Create a Home Valuation Report for This Property
The Home Valuation Report is an in-depth analysis detailing your home's value as well as a comparison with similar homes in the area
Home Values in the Area
Average Home Value in this Area
Purchase History
| Date | Buyer | Sale Price | Title Company |
|---|---|---|---|
| Ybarra Bradley S | $314,162 | Aegis Land Title Group | |
| Woo Alice F | $163,400 | Commonwealth Land Title Ins |
Source: Public Records
Mortgage History
| Date | Status | Borrower | Loan Amount |
|---|---|---|---|
| Previous Owner | Woo Alice F | $114,380 |
Source: Public Records
Tax History Compared to Growth
Tax History
| Year | Tax Paid | Tax Assessment Tax Assessment Total Assessment is a certain percentage of the fair market value that is determined by local assessors to be the total taxable value of land and additions on the property. | Land | Improvement |
|---|---|---|---|---|
| 2026 | $5,656 | $686,890 | $299,370 | $387,520 |
| 2025 | $5,656 | $686,890 | $299,370 | $387,520 |
| 2024 | $5,407 | $686,890 | $299,370 | $387,520 |
| 2023 | $5,634 | $686,890 | $299,370 | $387,520 |
| 2022 | $5,851 | $610,440 | $213,250 | $397,190 |
| 2021 | $5,739 | $571,160 | $199,670 | $371,490 |
| 2020 | $5,502 | $539,260 | $188,800 | $350,460 |
| 2019 | $5,060 | $504,840 | $176,580 | $328,260 |
| 2018 | $5,017 | $389,330 | $135,830 | $253,500 |
| 2017 | $4,129 | $389,330 | $135,830 | $253,500 |
| 2016 | $3,893 | $349,010 | $135,830 | $213,180 |
| 2015 | $3,344 | $304,080 | $118,660 | $185,420 |
| 2014 | -- | $280,760 | $118,660 | $162,100 |
| 2013 | -- | $262,960 | $110,850 | $152,110 |
Source: Public Records
Map
Nearby Homes
- 228 Canopy Path NW
- 224 Canopy Path NW
- 208 Shepard Way NW
- 204 Shepard Way NW
- 3 Bedroom Plan at Trillium, Grow Community | Bainbridge Island - The Trillium
- 2 Bedroom Plan at Trillium, Grow Community | Bainbridge Island - The Trillium
- 645 Madison Ave N
- 115 Hall Brothers Loop NW Unit 203
- 737 Village Cir NW
- 346 Wyatt Way NE Unit 10
- 962 Dove Tail Ln NW Unit 3
- 360 Knechtel Way NE Unit 201
- 511 Groos Ln NE
- 1116 Grow Ave NW
- 213 Eakin Dr NW
- 141 Parfitt Way SW Unit M-10
- 141 Parfitt Way SW Unit M-40
- 752 NE Vineyard Ln Unit L205
- 465 Winslow Way E Unit 108
- 610 NE Vineyard Ln Unit A104
- 421 Grow Ave NW
- 470 Grow Ave NW
- 491 Grow Ave NW
- 433 Grow Ave NW
- 401 Grow Ave NW
- 480 Grow Place NW
- 452 Grow Ave NW
- 460 Grow Ave NW
- 436 Grow Ave NW
- 431 Grow Ave NW
- 444 Grow Ave NW
- 472 Grow Ave NW
- 468 Grow Ave NW
- 440 Grow Ave NW
- 375 Grow Ave NW
- 456 Grow Ave NW
- 490 Grow Place NW
- 441 Sprout Path NW
- 433 Sprout Path NW
- 449 Sprout Path NW