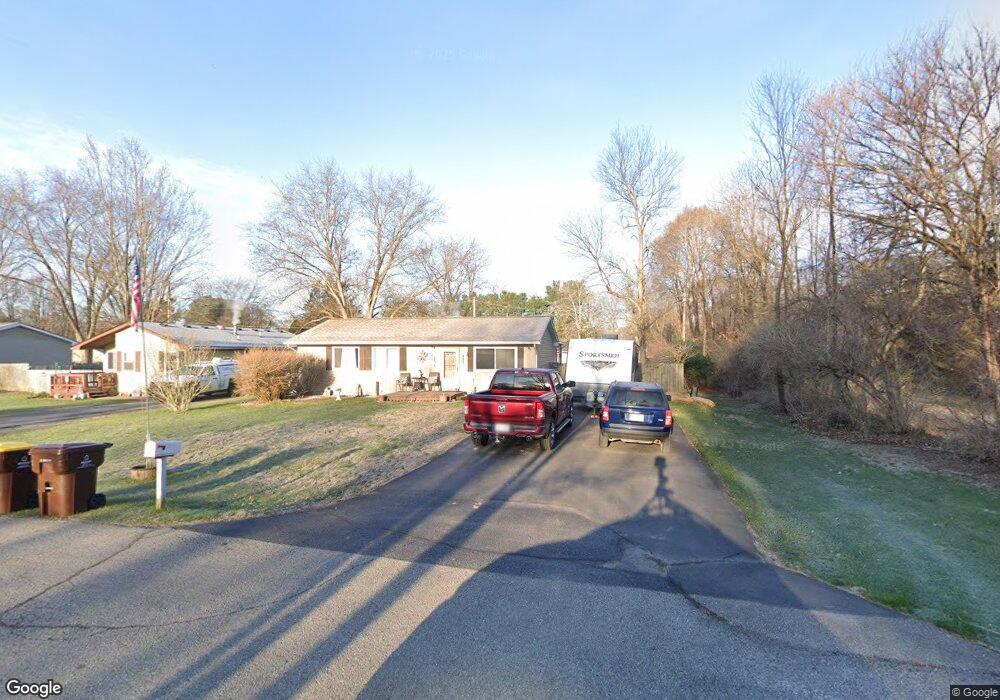
441 Haze Pinckney, MI 48169
Estimated Value: $239,809 - $272,000
3
Beds
2
Baths
1,008
Sq Ft
$255/Sq Ft
Est. Value
About This Home
This home is located at 441 Haze, Pinckney, MI 48169 and is currently estimated at $257,452, approximately $255 per square foot. 441 Haze is a home located in Livingston County with nearby schools including Farley Hill Elementary School, Pathfinder School, and Navigator School.
Ownership History
Date
Name
Owned For
Owner Type
Purchase Details
Closed on
Jun 27, 2022
Sold by
Ball Dennis R and Ball Denise
Bought by
Dennis Raymond Ball And Denise Glodzik-Ball T
Current Estimated Value
Purchase Details
Closed on
Apr 28, 2004
Sold by
Mincy Craig A and Mincy Lynley
Bought by
Cromin Kathy
Purchase Details
Closed on
May 14, 2003
Sold by
Hud
Bought by
Mincy Craig A and Mincy Lloyd T
Home Financials for this Owner
Home Financials are based on the most recent Mortgage that was taken out on this home.
Original Mortgage
$89,200
Interest Rate
5.88%
Mortgage Type
Purchase Money Mortgage
Purchase Details
Closed on
May 20, 2002
Sold by
Countrywide Home Loans Inc
Bought by
Hud
Purchase Details
Closed on
Mar 20, 2002
Sold by
North William A and North Renee L
Bought by
Countrywide Home Loans Inc
Purchase Details
Closed on
Dec 28, 1998
Sold by
Meloche Dennis J and Meloche Karen Faune
Bought by
North William A
Create a Home Valuation Report for This Property
The Home Valuation Report is an in-depth analysis detailing your home's value as well as a comparison with similar homes in the area
Home Values in the Area
Average Home Value in this Area
Purchase History
| Date | Buyer | Sale Price | Title Company |
|---|---|---|---|
| Dennis Raymond Ball And Denise Glodzik-Ball T | -- | None Listed On Document | |
| Cromin Kathy | $139,000 | -- | |
| Mincy Craig A | -- | -- | |
| Hud | -- | -- | |
| Countrywide Home Loans Inc | $100,860 | -- | |
| North William A | $99,900 | Select Title Company |
Source: Public Records
Mortgage History
| Date | Status | Borrower | Loan Amount |
|---|---|---|---|
| Previous Owner | Mincy Craig A | $89,200 | |
| Closed | Mincy Craig A | $16,730 |
Source: Public Records
Tax History
| Year | Tax Paid | Tax Assessment Tax Assessment Total Assessment is a certain percentage of the fair market value that is determined by local assessors to be the total taxable value of land and additions on the property. | Land | Improvement |
|---|---|---|---|---|
| 2025 | $1,483 | $109,260 | $0 | $0 |
| 2024 | $1,445 | $97,299 | $0 | $0 |
| 2023 | $1,378 | $89,412 | $0 | $0 |
| 2022 | $0 | $93,279 | $0 | $0 |
| 2021 | $2,218 | $73,160 | $0 | $0 |
| 2020 | $1,662 | $68,260 | $0 | $0 |
| 2019 | $2,165 | $71,110 | $0 | $0 |
| 2018 | $2,117 | $61,150 | $0 | $0 |
| 2017 | $2,081 | $61,150 | $0 | $0 |
| 2016 | $1,997 | $56,170 | $0 | $0 |
| 2014 | $1,719 | $57,510 | $0 | $0 |
| 2012 | $1,719 | $49,250 | $0 | $0 |
Source: Public Records
Map
Nearby Homes
- 433 Haze
- 377 Pond St
- 260 W Unadilla St
- Lot 37 Alta Vista Dr
- Lot 33 Alta Vista Dr
- 220 Pearl St
- 0 Livingston Unit 20251013277
- 512 E Main St
- 240 Park St
- 3073 Gecko Trail
- 711 Cattail Ln
- 3659 Outback Trail
- 3353 Outback Trail
- 3681 Outback Trail
- 3304 Outback Trail
- 187 Darwin Rd
- 8630 Joey Dr
- 2551 Patterson Lake Rd
- 167 Forest Valley Ct
- 3096 Hunters Way Unit 68
Your Personal Tour Guide
Ask me questions while you tour the home.