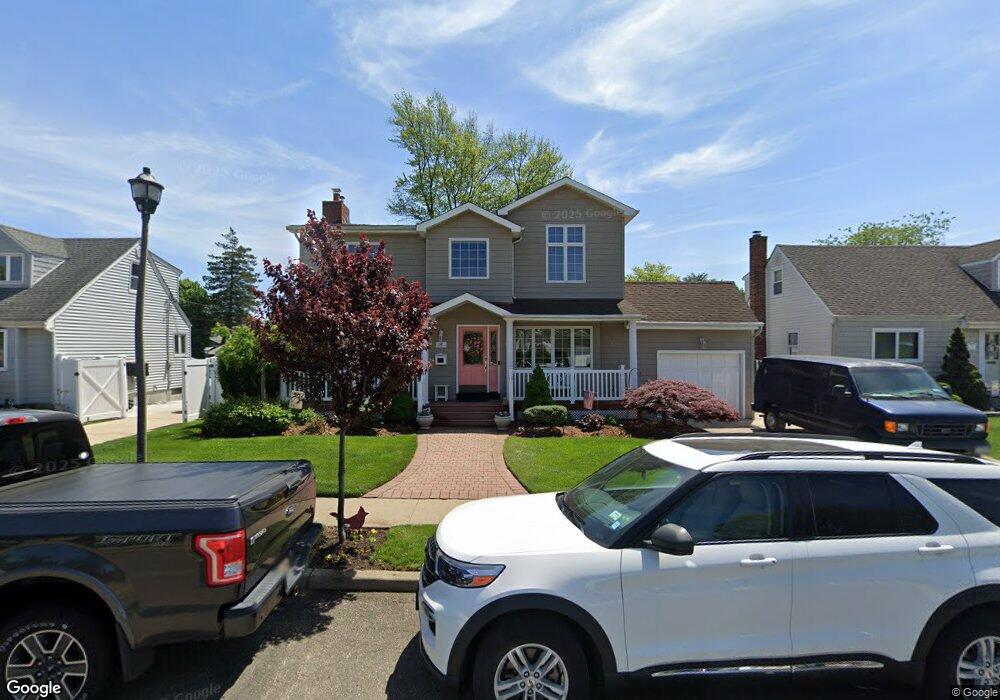
441 Jefferson St Franklin Square, NY 11010
Estimated Value: $960,000 - $1,045,588
Studio
3
Baths
2,528
Sq Ft
$397/Sq Ft
Est. Value
About This Home
This home is located at 441 Jefferson St, Franklin Square, NY 11010 and is currently estimated at $1,002,794, approximately $396 per square foot. 441 Jefferson St is a home located in Nassau County with nearby schools including Hebrew Academy of Nassau County (HANC).
Ownership History
Date
Name
Owned For
Owner Type
Purchase Details
Closed on
Aug 28, 2019
Sold by
Vella Lino and Vella Mary Ellen
Bought by
Vella Trust
Current Estimated Value
Create a Home Valuation Report for This Property
The Home Valuation Report is an in-depth analysis detailing your home's value as well as a comparison with similar homes in the area
Home Values in the Area
Average Home Value in this Area
Purchase History
| Date | Buyer | Sale Price | Title Company |
|---|---|---|---|
| Vella Trust | -- | Judicial Title |
Source: Public Records
Tax History
| Year | Tax Paid | Tax Assessment Tax Assessment Total Assessment is a certain percentage of the fair market value that is determined by local assessors to be the total taxable value of land and additions on the property. | Land | Improvement |
|---|---|---|---|---|
| 2025 | $15,154 | $724 | $299 | $425 |
| 2024 | $6,195 | $724 | $299 | $425 |
Source: Public Records
Map
Nearby Homes
- 850 First Ave
- 912 Oaks Dr
- 562 Bernice Rd
- 1020 Polk Ave
- 1024 Oaks Dr
- 597 Seminole Rd
- 660 Hewlett St
- 708 Anderson Ave
- 1053 Lorraine Dr
- 1035 Glen Dr
- 1007 Third Ave
- 738 Sprague Ave
- 242 James St
- 1004 Wool Ave
- 249 Grange St
- 280 Franklin Ave Unit 11
- 232 Ribbon St
- 190 Commonwealth St
- 340 Doris Ave
- 1132 Norbay St
- 447 Jefferson St
- 435 Jefferson St
- 429 Jefferson St
- 453 Jefferson St
- 861 Polk Ave
- 444 Jefferson St
- 444 Howard Ave
- 438 Howard Ave
- 423 Jefferson St
- 432 Howard Ave
- 459 Jefferson St
- 448 Howard Ave
- 867 Polk Ave
- 855 Tyler St
- 870 Tyler St
- 426 Howard Ave
- 873 Polk Ave
- 874 Tyler St
- 424 Jefferson St
- 424 Jefferson St
Your Personal Tour Guide
Ask me questions while you tour the home.