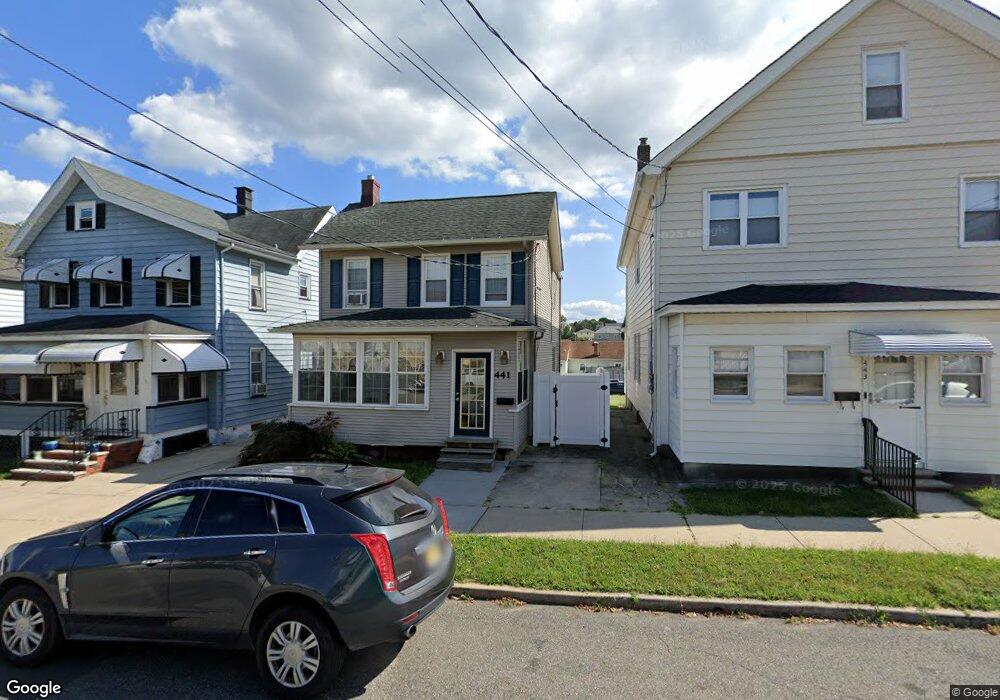
441 John St South Amboy, NJ 08879
Estimated Value: $423,000 - $536,000
3
Beds
2
Baths
1,200
Sq Ft
$388/Sq Ft
Est. Value
About This Home
This home is located at 441 John St, South Amboy, NJ 08879 and is currently estimated at $465,917, approximately $388 per square foot. 441 John St is a home located in Middlesex County with nearby schools including South Amboy Elementary School, South Amboy Middle/High School, and St. Mary Elementary School.
Ownership History
Date
Name
Owned For
Owner Type
Purchase Details
Closed on
Jan 15, 2016
Sold by
Harmony Development Llc
Bought by
Savino Gregory Thomas
Current Estimated Value
Home Financials for this Owner
Home Financials are based on the most recent Mortgage that was taken out on this home.
Original Mortgage
$170,000
Outstanding Balance
$135,469
Interest Rate
4.02%
Mortgage Type
New Conventional
Estimated Equity
$330,448
Purchase Details
Closed on
Apr 29, 2015
Sold by
Connell Kevin O and Connell Michele O
Bought by
Harmony Development Llc
Purchase Details
Closed on
Dec 20, 2002
Sold by
Zaleski Robert
Bought by
O'Connell Kevin
Home Financials for this Owner
Home Financials are based on the most recent Mortgage that was taken out on this home.
Original Mortgage
$152,450
Interest Rate
6.09%
Mortgage Type
FHA
Create a Home Valuation Report for This Property
The Home Valuation Report is an in-depth analysis detailing your home's value as well as a comparison with similar homes in the area
Home Values in the Area
Average Home Value in this Area
Purchase History
| Date | Buyer | Sale Price | Title Company |
|---|---|---|---|
| Savino Gregory Thomas | $212,500 | None Available | |
| Harmony Development Llc | $136,100 | None Available | |
| O'Connell Kevin | $106,000 | -- |
Source: Public Records
Mortgage History
| Date | Status | Borrower | Loan Amount |
|---|---|---|---|
| Open | Savino Gregory Thomas | $170,000 | |
| Previous Owner | O'Connell Kevin | $152,450 |
Source: Public Records
Tax History Compared to Growth
Tax History
| Year | Tax Paid | Tax Assessment Tax Assessment Total Assessment is a certain percentage of the fair market value that is determined by local assessors to be the total taxable value of land and additions on the property. | Land | Improvement |
|---|---|---|---|---|
| 2025 | $7,037 | $219,300 | $113,000 | $106,300 |
| 2024 | $6,772 | $219,300 | $113,000 | $106,300 |
| 2023 | $6,772 | $219,300 | $113,000 | $106,300 |
| 2022 | $6,434 | $219,300 | $113,000 | $106,300 |
| 2021 | $6,327 | $219,300 | $113,000 | $106,300 |
| 2020 | $6,178 | $219,300 | $113,000 | $106,300 |
| 2019 | $6,079 | $219,300 | $113,000 | $106,300 |
| 2018 | $6,029 | $219,300 | $113,000 | $106,300 |
| 2017 | $5,932 | $219,300 | $113,000 | $106,300 |
| 2016 | $5,783 | $219,300 | $113,000 | $106,300 |
| 2015 | $5,825 | $219,300 | $113,000 | $106,300 |
| 2014 | $5,625 | $219,300 | $113,000 | $106,300 |
Source: Public Records
Map
Nearby Homes