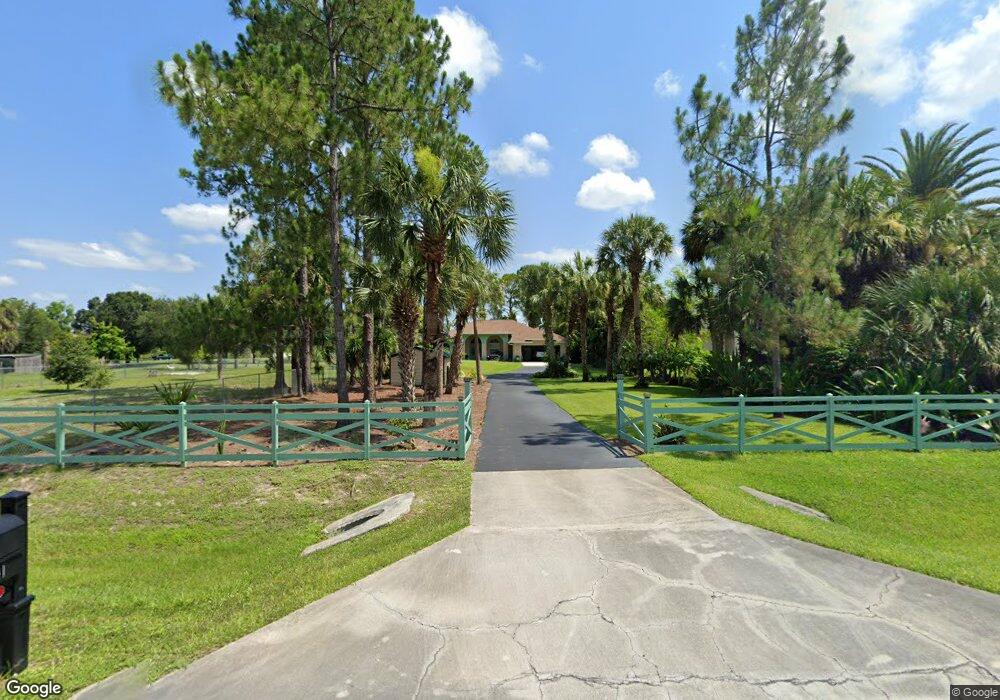
441 Jung Blvd E Naples, FL 34120
Rural Estates NeighborhoodEstimated Value: $613,986 - $767,000
4
Beds
3
Baths
2,600
Sq Ft
$266/Sq Ft
Est. Value
About This Home
This home is located at 441 Jung Blvd E, Naples, FL 34120 and is currently estimated at $690,997, approximately $265 per square foot. 441 Jung Blvd E is a home located in Collier County with nearby schools including Corkscrew Elementary School, Corkscrew Middle School, and Gulf Coast High School.
Ownership History
Date
Name
Owned For
Owner Type
Purchase Details
Closed on
Jul 16, 2021
Sold by
Halsted Steven C and Halsted Alta Kathie
Bought by
Halsted Steven C and Halsted Alta Kathie
Current Estimated Value
Home Financials for this Owner
Home Financials are based on the most recent Mortgage that was taken out on this home.
Original Mortgage
$825,000
Outstanding Balance
$812,167
Interest Rate
2.78%
Estimated Equity
-$121,170
Purchase Details
Closed on
Jul 7, 2014
Sold by
Dillon John F
Bought by
The Steven C & Alta Kathie Halsted Livin
Purchase Details
Closed on
Aug 15, 2003
Sold by
Thomas Barry R
Bought by
Dillon John F
Purchase Details
Closed on
Sep 8, 1995
Sold by
Dillon John F
Bought by
Rychwalski Daniel S and Rychwalski Rhonda
Home Financials for this Owner
Home Financials are based on the most recent Mortgage that was taken out on this home.
Original Mortgage
$5,505
Interest Rate
7.76%
Mortgage Type
Purchase Money Mortgage
Create a Home Valuation Report for This Property
The Home Valuation Report is an in-depth analysis detailing your home's value as well as a comparison with similar homes in the area
Home Values in the Area
Average Home Value in this Area
Purchase History
| Date | Buyer | Sale Price | Title Company |
|---|---|---|---|
| Halsted Steven C | -- | Assure Title Llc | |
| The Steven C & Alta Kathie Halsted Livin | $280,000 | None Available | |
| Dillon John F | $3,200 | -- | |
| Rychwalski Daniel S | -- | -- |
Source: Public Records
Mortgage History
| Date | Status | Borrower | Loan Amount |
|---|---|---|---|
| Open | Halsted Steven C | $825,000 | |
| Closed | Halsted Steven C | $825,000 | |
| Previous Owner | Rychwalski Daniel S | $5,505 |
Source: Public Records
Tax History
| Year | Tax Paid | Tax Assessment Tax Assessment Total Assessment is a certain percentage of the fair market value that is determined by local assessors to be the total taxable value of land and additions on the property. | Land | Improvement |
|---|---|---|---|---|
| 2025 | $4,178 | $374,347 | -- | -- |
| 2024 | $4,165 | $363,797 | -- | -- |
| 2023 | $4,165 | $353,201 | $0 | $0 |
| 2022 | $4,213 | $342,914 | $0 | $0 |
| 2021 | $4,216 | $332,926 | $0 | $0 |
| 2020 | $4,121 | $328,329 | $0 | $0 |
| 2019 | $4,040 | $320,947 | $0 | $0 |
| 2018 | $3,882 | $314,963 | $0 | $0 |
| 2017 | $3,815 | $308,485 | $0 | $0 |
| 2016 | $3,313 | $272,342 | $0 | $0 |
| 2015 | $3,759 | $262,142 | $0 | $0 |
| 2014 | -- | $186,170 | $0 | $0 |
Source: Public Records
Map
Nearby Homes
- 467 20th Ave NE
- 0 18th Ave SE Unit MFRTB8417632
- 239 20th Ave NE
- 106 18th Ave NE
- 110 16th Ave NE
- 218 22nd Ave NE
- 0 16th Ave NE Unit 225037055
- 0 14th Ave NE Unit 225080904
- 0 12th Ave NE Unit MFRV4933451
- 1234 8th St NE
- 2130 Wilson Blvd N
- 159 12th Ave NE
- 169 18th Ave NW
- 24th Ave NE
- 141 20th Ave NW
- 1041 20th Ave NE
- 221 18th Ave NW Unit 20
- 2280 Wilson Blvd N
- 927 12th Ave NE
- 152 14th Ave NW
- 461 Jung Blvd E
- 430 18th Ave NE Unit 23
- 420 NE 18 Ave
- 420 NE 18 Ave NE
- 420 18th Ave NE
- 490 18th Ave NE
- 388 18th Ave NE
- 513 Jung Blvd E
- 471 18th Ave NE
- 360 18th Ave NE
- 441 18th Ave NE
- 411 18th Ave NE
- 530 18th Ave NE
- 431 16th Ave NE
- 463 18th Ave NE
- 391 18th Ave NE
- 461 16th Ave NE
- 560 18th Ave NE
- 333100 18 Ave NE
- 511 18th Ave NE
Your Personal Tour Guide
Ask me questions while you tour the home.