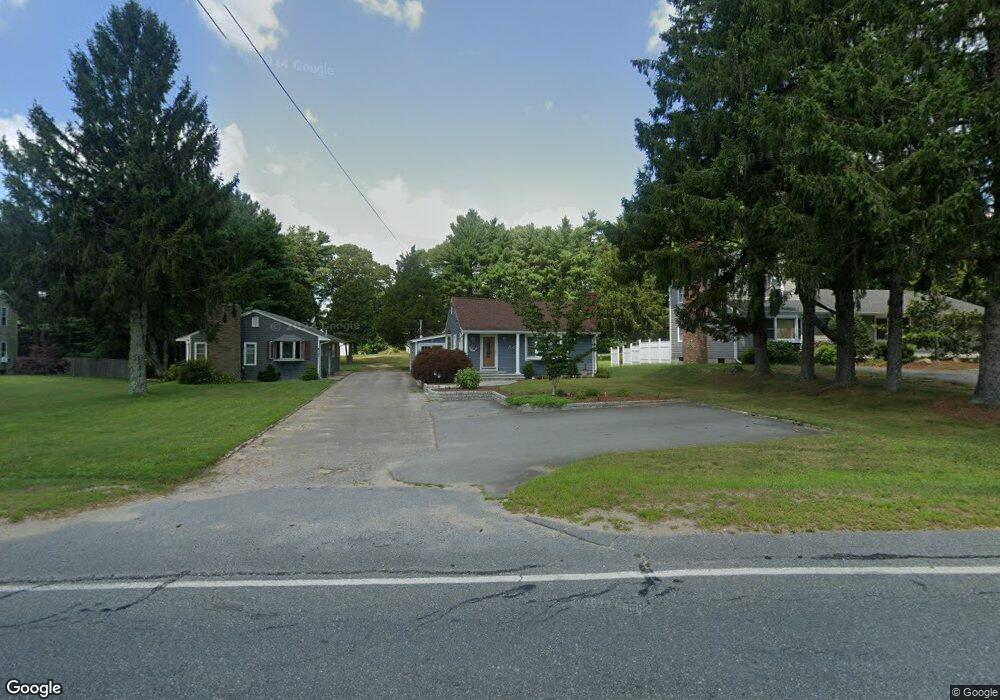
441 Main St Acushnet, MA 02743
Upper Acushnet NeighborhoodEstimated Value: $438,992 - $595,000
Studio
2
Baths
1,583
Sq Ft
$323/Sq Ft
Est. Value
About This Home
This home is located at 441 Main St, Acushnet, MA 02743 and is currently estimated at $511,248, approximately $322 per square foot. 441 Main St is a home located in Bristol County with nearby schools including Acushnet Elementary School, Albert F Ford Middle School, and Alma Del Mar Charter School.
Ownership History
Date
Name
Owned For
Owner Type
Purchase Details
Closed on
May 31, 1994
Sold by
Martin Sandra J
Bought by
Fonseca Sari A and Fonseca Antone K
Current Estimated Value
Home Financials for this Owner
Home Financials are based on the most recent Mortgage that was taken out on this home.
Original Mortgage
$114,571
Interest Rate
8.22%
Mortgage Type
Purchase Money Mortgage
Create a Home Valuation Report for This Property
The Home Valuation Report is an in-depth analysis detailing your home's value as well as a comparison with similar homes in the area
Home Values in the Area
Average Home Value in this Area
Purchase History
| Date | Buyer | Sale Price | Title Company |
|---|---|---|---|
| Fonseca Sari A | $115,000 | -- |
Source: Public Records
Mortgage History
| Date | Status | Borrower | Loan Amount |
|---|---|---|---|
| Open | Fonseca Sari A | $50,000 | |
| Open | Fonseca Sari A | $111,500 | |
| Closed | Fonseca Sari A | $114,571 |
Source: Public Records
Tax History
| Year | Tax Paid | Tax Assessment Tax Assessment Total Assessment is a certain percentage of the fair market value that is determined by local assessors to be the total taxable value of land and additions on the property. | Land | Improvement |
|---|---|---|---|---|
| 2025 | $40 | $373,600 | $128,100 | $245,500 |
| 2024 | $3,912 | $342,900 | $121,400 | $221,500 |
| 2023 | $3,803 | $316,900 | $110,100 | $206,800 |
| 2022 | $3,790 | $285,600 | $103,400 | $182,200 |
| 2021 | $2,830 | $265,300 | $103,400 | $161,900 |
| 2020 | $2,373 | $258,500 | $96,600 | $161,900 |
| 2019 | $3,471 | $244,800 | $92,100 | $152,700 |
| 2018 | $3,278 | $233,800 | $92,100 | $141,700 |
| 2017 | $3,271 | $226,500 | $92,100 | $134,400 |
| 2016 | $3,197 | $220,000 | $92,100 | $127,900 |
| 2015 | $3,044 | $213,200 | $92,100 | $121,100 |
Source: Public Records
Map
Nearby Homes
- 489 Main St
- 363 Main St
- 25 Pershing Ave
- 23 Oliveira Ave
- 12 White St
- 0 Hathaway Rd Unit 73469544
- 329 Middle Rd
- 191 Hathaway Rd
- 7 Hamlin St
- 11 Boylston St
- 0 Land Way Unit 73479153
- 23 Coury Dr
- 134 Nyes Ln
- 14 Hayes St Unit 1
- 12 Hayes St Unit 1
- 27 Meadow Ln
- 15 Ball St
- 65 Armsby St
- 1027 Kenmore St
- ES Acushnet Ave
Your Personal Tour Guide
Ask me questions while you tour the home.