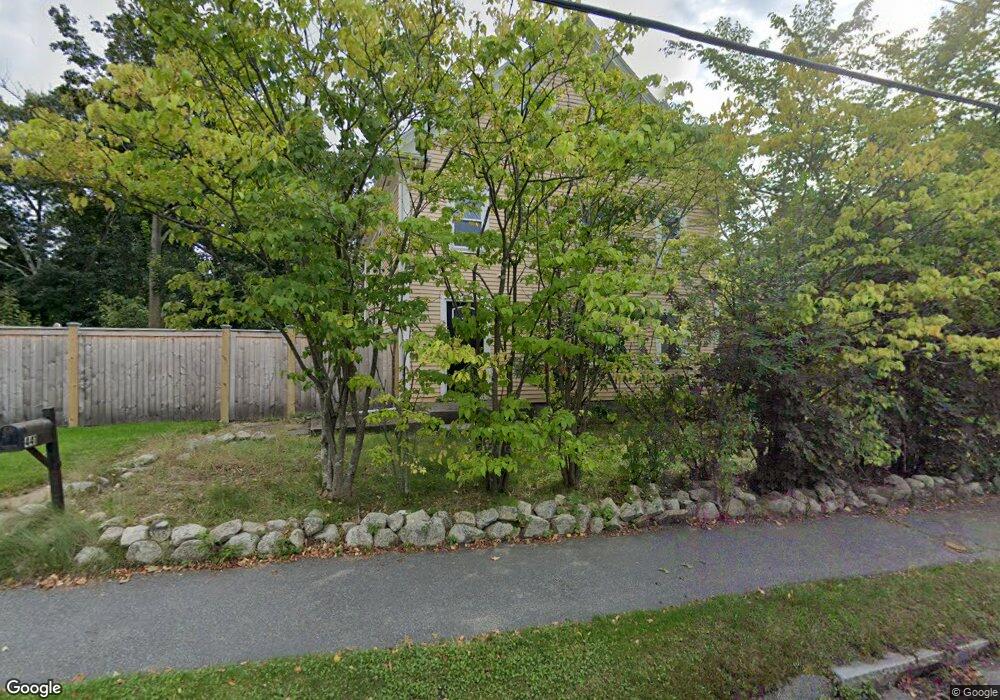
441 Main St Unit 1 Concord, MA 01742
Estimated Value: $1,117,000 - $1,373,000
4
Beds
2
Baths
2,246
Sq Ft
$562/Sq Ft
Est. Value
About This Home
This home is located at 441 Main St Unit 1, Concord, MA 01742 and is currently estimated at $1,261,462, approximately $561 per square foot. 441 Main St Unit 1 is a home located in Middlesex County with nearby schools including Willard School, Concord Middle School, and Concord Carlisle High School.
Ownership History
Date
Name
Owned For
Owner Type
Purchase Details
Closed on
Jul 27, 2006
Sold by
Stewart Kathleen
Bought by
Olson Sven T
Current Estimated Value
Home Financials for this Owner
Home Financials are based on the most recent Mortgage that was taken out on this home.
Original Mortgage
$399,200
Outstanding Balance
$238,499
Interest Rate
6.67%
Mortgage Type
Purchase Money Mortgage
Estimated Equity
$1,022,963
Purchase Details
Closed on
Jul 31, 1995
Sold by
Lonergan Thomas J and Lonergan Susan B
Bought by
Stewart Kathleen
Home Financials for this Owner
Home Financials are based on the most recent Mortgage that was taken out on this home.
Original Mortgage
$169,600
Interest Rate
7.56%
Mortgage Type
Purchase Money Mortgage
Create a Home Valuation Report for This Property
The Home Valuation Report is an in-depth analysis detailing your home's value as well as a comparison with similar homes in the area
Home Values in the Area
Average Home Value in this Area
Purchase History
| Date | Buyer | Sale Price | Title Company |
|---|---|---|---|
| Olson Sven T | $499,000 | -- | |
| Stewart Kathleen | $212,000 | -- |
Source: Public Records
Mortgage History
| Date | Status | Borrower | Loan Amount |
|---|---|---|---|
| Open | Olson Sven T | $399,200 | |
| Previous Owner | Stewart Kathleen | $229,000 | |
| Previous Owner | Stewart Kathleen | $169,600 |
Source: Public Records
Tax History Compared to Growth
Tax History
| Year | Tax Paid | Tax Assessment Tax Assessment Total Assessment is a certain percentage of the fair market value that is determined by local assessors to be the total taxable value of land and additions on the property. | Land | Improvement |
|---|---|---|---|---|
| 2025 | $119 | $894,200 | $424,900 | $469,300 |
| 2024 | $11,508 | $876,500 | $424,900 | $451,600 |
| 2023 | $9,828 | $758,300 | $386,300 | $372,000 |
| 2022 | $10,576 | $716,500 | $309,100 | $407,400 |
| 2021 | $9,842 | $668,600 | $309,100 | $359,500 |
| 2020 | $9,655 | $678,500 | $309,100 | $369,400 |
| 2019 | $9,050 | $637,800 | $300,100 | $337,700 |
| 2018 | $8,407 | $588,300 | $285,800 | $302,500 |
| 2017 | $8,185 | $581,700 | $272,200 | $309,500 |
| 2016 | $7,746 | $556,500 | $272,200 | $284,300 |
| 2015 | $7,259 | $508,000 | $252,000 | $256,000 |
Source: Public Records
Map
Nearby Homes
- 106 Elm St
- 46 Wood St
- 22 Belknap Ct
- 182 Southfield Rd
- 168 Nashawtuc Rd
- 602 Main St
- 14 Thoreau St
- 49 Willard Common
- 29 Willard Common
- 232 Sudbury Rd
- 343 Nashawtuc Rd
- 38 McCallar Ln
- 46 Sudbury Rd
- 213 Nashoba Rd
- 100 Keyes Rd Unit 216
- 244 Musterfield Rd
- 488 Elm St
- 295 Musterfield Rd
- 143 Everett St
- 84 Bruce Rd