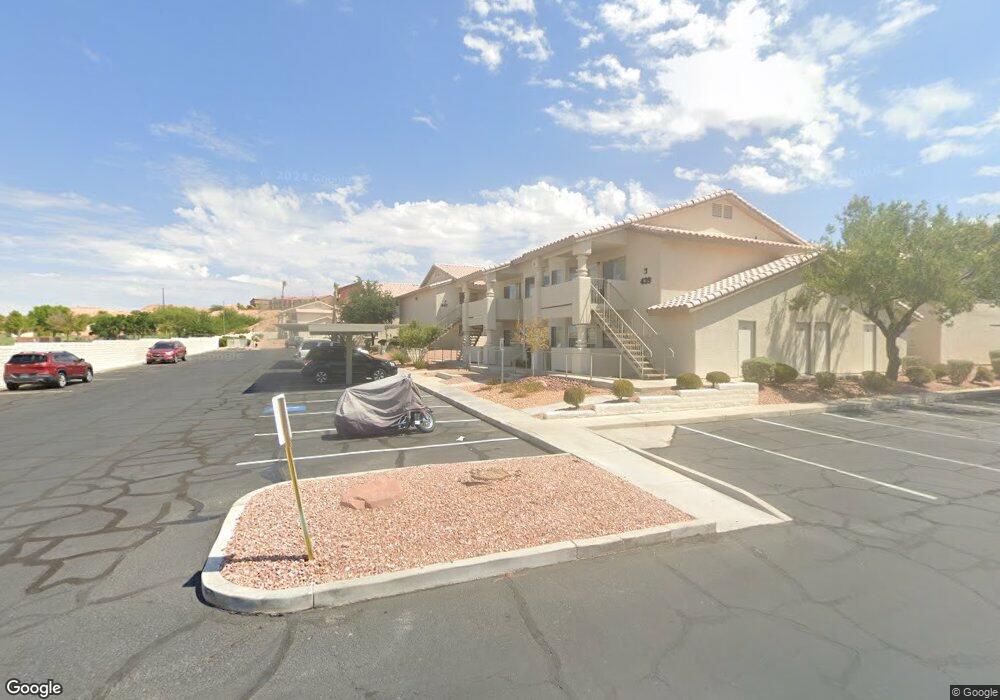
441 Mesa Blvd Unit 202 Mesquite, NV 89027
Estimated Value: $178,487 - $197,000
2
Beds
2
Baths
1,192
Sq Ft
$158/Sq Ft
Est. Value
About This Home
This home is located at 441 Mesa Blvd Unit 202, Mesquite, NV 89027 and is currently estimated at $187,872, approximately $157 per square foot. 441 Mesa Blvd Unit 202 is a home located in Clark County with nearby schools including Virgin Valley Elementary School, Charles Arthur Hughes Middle School, and Virgin Valley High School.
Ownership History
Date
Name
Owned For
Owner Type
Purchase Details
Closed on
Sep 24, 2022
Sold by
Lytle James D
Bought by
Lytle Family Revocable Trust
Current Estimated Value
Purchase Details
Closed on
Feb 23, 2021
Sold by
Carrick James G and Carrick Kathleen M
Bought by
Lytle James and Lytle Nikki
Purchase Details
Closed on
Apr 16, 2004
Sold by
Medlock Russel L and Watkins Jean
Bought by
Carrick James G and Carrick Kathleen M
Purchase Details
Closed on
Jan 7, 2003
Sold by
Petersen Robert J and Petersen Judy A
Bought by
Medlock Russell L and Watkins Jean
Purchase Details
Closed on
Sep 25, 2002
Sold by
Brenden Robert and Brenden Marlene
Bought by
Petersen Robert J and Petersen Judy A
Purchase Details
Closed on
Jan 24, 2000
Sold by
Comford D Gregory
Bought by
Brenden Robert and Brenden Marlene
Purchase Details
Closed on
Jan 5, 2000
Sold by
Va
Bought by
Comford D Gregory
Create a Home Valuation Report for This Property
The Home Valuation Report is an in-depth analysis detailing your home's value as well as a comparison with similar homes in the area
Home Values in the Area
Average Home Value in this Area
Purchase History
| Date | Buyer | Sale Price | Title Company |
|---|---|---|---|
| Lytle Family Revocable Trust | -- | -- | |
| Lytle James | $151,900 | Fidelity National Title M | |
| Carrick James G | $86,500 | Lawyers Title Of Nevada | |
| Medlock Russell L | $76,500 | Fidelity National Title | |
| Petersen Robert J | $74,600 | Fidelity National Title | |
| Brenden Robert | $65,000 | Fidelity National Title Agen | |
| Comford D Gregory | $62,000 | Fidelity National Title Agen |
Source: Public Records
Tax History Compared to Growth
Tax History
| Year | Tax Paid | Tax Assessment Tax Assessment Total Assessment is a certain percentage of the fair market value that is determined by local assessors to be the total taxable value of land and additions on the property. | Land | Improvement |
|---|---|---|---|---|
| 2025 | $856 | $43,424 | $15,050 | $28,374 |
| 2024 | $856 | $43,424 | $15,050 | $28,374 |
| 2023 | $856 | $48,060 | $21,700 | $26,360 |
| 2022 | $793 | $41,731 | $17,325 | $24,406 |
| 2021 | $734 | $37,431 | $13,650 | $23,781 |
| 2020 | $680 | $37,335 | $13,650 | $23,685 |
| 2019 | $660 | $34,088 | $10,500 | $23,588 |
| 2018 | $641 | $28,646 | $5,600 | $23,046 |
| 2017 | $729 | $26,298 | $5,250 | $21,048 |
| 2016 | $606 | $27,245 | $4,550 | $22,695 |
| 2015 | $534 | $21,342 | $3,500 | $17,842 |
| 2014 | $588 | $21,011 | $5,250 | $15,761 |
Source: Public Records
Map
Nearby Homes
- 890 Kitty Hawk Dr Unit 2523
- 714 Appletree Ln
- 704 Appletree Ln
- 931 Monaco Cir
- 726 Mesa Springs Dr
- 601 Hillside Dr
- 744 Pinnacle Ct
- 1074 Chaparral Dr
- 555 Highland Dr Unit 330
- 870 Ironwood Dr
- 1213 Ivy Lee Crest
- 1136 Mohave Dr
- 2453 S Tessaro Ct
- 1222 Blind Pew Ridge
- 1180 Mesa Verde Run
- 465 Turtleback Rd Unit B
- 1309 Vista Del Monte Dr
- 140 Admiral Benbow Way
- 957 Diamond Cir
- 1414 Pomegranate Trail
- 441 Mesa Blvd Unit 102
- 441 Mesa Blvd Unit 201
- 441 Mesa Blvd Unit 101
- 443 Mesa Blvd Unit 102
- 443 Mesa Blvd Unit 201
- 443 Mesa Blvd Unit 101
- 443 Mesa Blvd Unit 202
- 435 Mesa Blvd Unit 101
- 435 Mesa Blvd Unit 202
- 435 Mesa Blvd Unit 201
- 435 Mesa Blvd Unit 102
- 445 Mesa Blvd Unit 101
- 445 Mesa Blvd Unit 201
- 445 Mesa Blvd Unit 102
- 445 Mesa Blvd Unit 202
- 439 Mesa Blvd
- 439 Mesa Blvd Unit 202
- 439 Mesa Blvd Unit 201
- 439 Mesa Blvd Unit 102
- 439 Mesa Blvd Unit 101