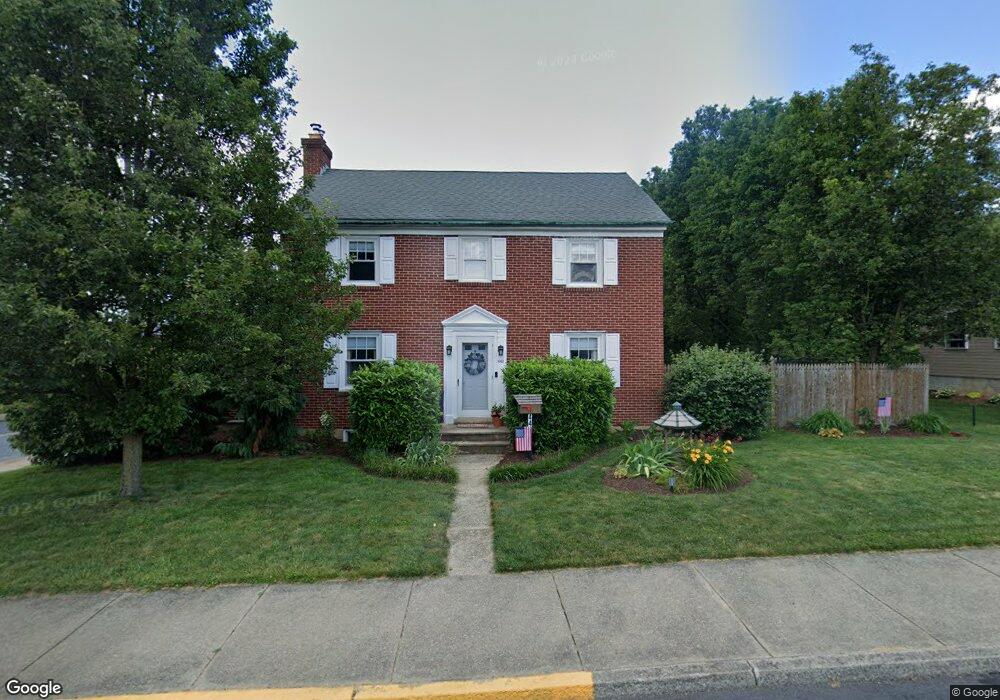
441 N 2nd St Unit 443 Emmaus, PA 18049
Estimated Value: $414,000 - $444,000
3
Beds
3
Baths
1,792
Sq Ft
$239/Sq Ft
Est. Value
About This Home
This home is located at 441 N 2nd St Unit 443, Emmaus, PA 18049 and is currently estimated at $427,623, approximately $238 per square foot. 441 N 2nd St Unit 443 is a home located in Lehigh County with nearby schools including Lincoln Elementary School, Lower Macungie Middle School, and Emmaus High School.
Ownership History
Date
Name
Owned For
Owner Type
Purchase Details
Closed on
Oct 19, 2010
Sold by
Kurtz Bruce B
Bought by
Korbler Joseph J
Current Estimated Value
Home Financials for this Owner
Home Financials are based on the most recent Mortgage that was taken out on this home.
Original Mortgage
$169,600
Outstanding Balance
$112,032
Interest Rate
4.37%
Mortgage Type
New Conventional
Estimated Equity
$315,591
Purchase Details
Closed on
Feb 29, 2008
Sold by
Ott Jeffrey L
Bought by
Kurtz Jamieson B
Home Financials for this Owner
Home Financials are based on the most recent Mortgage that was taken out on this home.
Original Mortgage
$206,400
Interest Rate
5.57%
Mortgage Type
New Conventional
Purchase Details
Closed on
Jan 12, 1994
Bought by
Ott Jeffrey L and Ott Joni F
Create a Home Valuation Report for This Property
The Home Valuation Report is an in-depth analysis detailing your home's value as well as a comparison with similar homes in the area
Home Values in the Area
Average Home Value in this Area
Purchase History
| Date | Buyer | Sale Price | Title Company |
|---|---|---|---|
| Korbler Joseph J | $212,000 | -- | |
| Kurtz Jamieson B | $258,000 | -- | |
| Ott Jeffrey L | $118,000 | -- |
Source: Public Records
Mortgage History
| Date | Status | Borrower | Loan Amount |
|---|---|---|---|
| Open | Korbler Joseph J | $169,600 | |
| Previous Owner | Kurtz Jamieson B | $206,400 |
Source: Public Records
Tax History Compared to Growth
Tax History
| Year | Tax Paid | Tax Assessment Tax Assessment Total Assessment is a certain percentage of the fair market value that is determined by local assessors to be the total taxable value of land and additions on the property. | Land | Improvement |
|---|---|---|---|---|
| 2025 | $7,732 | $219,500 | $43,400 | $176,100 |
| 2024 | $7,082 | $219,500 | $43,400 | $176,100 |
| 2023 | $6,945 | $219,500 | $43,400 | $176,100 |
| 2022 | $6,716 | $219,500 | $176,100 | $43,400 |
| 2021 | $6,547 | $219,500 | $43,400 | $176,100 |
| 2020 | $6,491 | $219,500 | $43,400 | $176,100 |
| 2019 | $6,318 | $219,500 | $43,400 | $176,100 |
| 2018 | $6,079 | $219,500 | $43,400 | $176,100 |
| 2017 | $5,892 | $219,500 | $43,400 | $176,100 |
| 2016 | -- | $219,500 | $43,400 | $176,100 |
| 2015 | -- | $231,400 | $43,400 | $188,000 |
| 2014 | -- | $213,200 | $43,400 | $169,800 |
Source: Public Records
Map
Nearby Homes