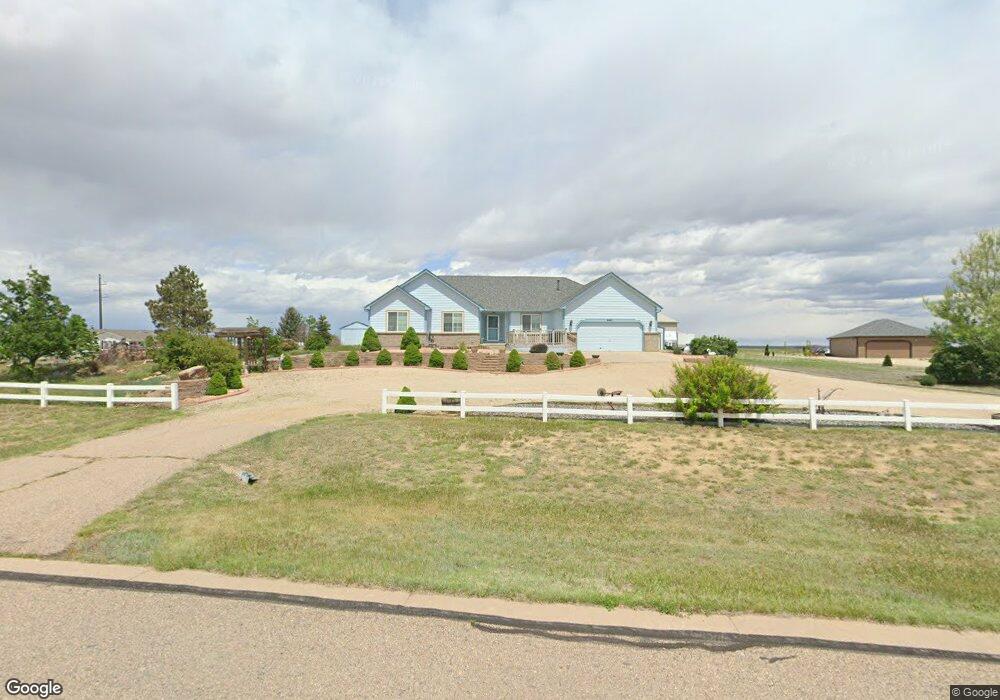
441 Puma Ln Milliken, CO 80543
Estimated Value: $726,000 - $850,000
3
Beds
3
Baths
1,842
Sq Ft
$430/Sq Ft
Est. Value
About This Home
This home is located at 441 Puma Ln, Milliken, CO 80543 and is currently estimated at $791,584, approximately $429 per square foot. 441 Puma Ln is a home located in Weld County with nearby schools including Milliken Elementary School, Milliken Middle School, and Roosevelt High School.
Ownership History
Date
Name
Owned For
Owner Type
Purchase Details
Closed on
Oct 5, 2010
Sold by
Hammers Ralph E and Wahlert Susan A
Bought by
Lightfoot James A and Lightfoot Sharon M
Current Estimated Value
Home Financials for this Owner
Home Financials are based on the most recent Mortgage that was taken out on this home.
Original Mortgage
$240,000
Outstanding Balance
$158,020
Interest Rate
4.46%
Mortgage Type
New Conventional
Estimated Equity
$633,564
Purchase Details
Closed on
Sep 13, 2001
Sold by
Parker Custom Homes Llc
Bought by
Hammers Ralph E and Wahlert Susan A
Home Financials for this Owner
Home Financials are based on the most recent Mortgage that was taken out on this home.
Original Mortgage
$231,000
Interest Rate
6.62%
Purchase Details
Closed on
Jan 19, 2000
Sold by
Ron Ehrlich Real Estate Llc
Bought by
Parker Custom Homes Llc
Home Financials for this Owner
Home Financials are based on the most recent Mortgage that was taken out on this home.
Original Mortgage
$46,875
Interest Rate
7.86%
Create a Home Valuation Report for This Property
The Home Valuation Report is an in-depth analysis detailing your home's value as well as a comparison with similar homes in the area
Home Values in the Area
Average Home Value in this Area
Purchase History
| Date | Buyer | Sale Price | Title Company |
|---|---|---|---|
| Lightfoot James A | $310,000 | Heritage Title | |
| Hammers Ralph E | $289,260 | -- | |
| Parker Custom Homes Llc | $62,500 | -- |
Source: Public Records
Mortgage History
| Date | Status | Borrower | Loan Amount |
|---|---|---|---|
| Open | Lightfoot James A | $240,000 | |
| Previous Owner | Hammers Ralph E | $231,000 | |
| Previous Owner | Parker Custom Homes Llc | $46,875 |
Source: Public Records
Tax History
| Year | Tax Paid | Tax Assessment Tax Assessment Total Assessment is a certain percentage of the fair market value that is determined by local assessors to be the total taxable value of land and additions on the property. | Land | Improvement |
|---|---|---|---|---|
| 2025 | $3,466 | $48,700 | $10,430 | $38,270 |
| 2024 | $3,466 | $48,700 | $10,430 | $38,270 |
| 2023 | $3,539 | $45,740 | $11,060 | $34,680 |
| 2022 | $4,104 | $41,940 | $9,310 | $32,630 |
| 2021 | $4,431 | $43,150 | $9,580 | $33,570 |
| 2020 | $4,145 | $34,400 | $6,570 | $27,830 |
| 2019 | $3,257 | $34,400 | $6,570 | $27,830 |
| 2018 | $3,008 | $31,040 | $5,000 | $26,040 |
| 2017 | $3,011 | $31,040 | $5,000 | $26,040 |
| 2016 | $2,655 | $27,120 | $4,020 | $23,100 |
| 2015 | $2,699 | $27,120 | $4,020 | $23,100 |
| 2014 | $2,290 | $23,280 | $3,920 | $19,360 |
Source: Public Records
Map
Nearby Homes
- 9411 Meadow Farms Dr
- 9360 Meadow Farms Dr
- 941 S Rachel Ave
- 303 W Juneberry St
- 831 S Rachel Ave
- 320 E Lilac St
- 280 E Katsura St
- 831 S Norma Ave
- 1530 S Haymaker Dr
- 221 E Holly St
- 1303 S Harvester Dr
- 1384 S Growers Dr
- 1364 S Growers Dr
- 1576 S Frances Ave
- 944 Harvard St
- 123 S Marjorie Ave
- 924 Harvard St
- 904 Harvard St
- 914 Harvard St
- 849 Harvard St
Your Personal Tour Guide
Ask me questions while you tour the home.