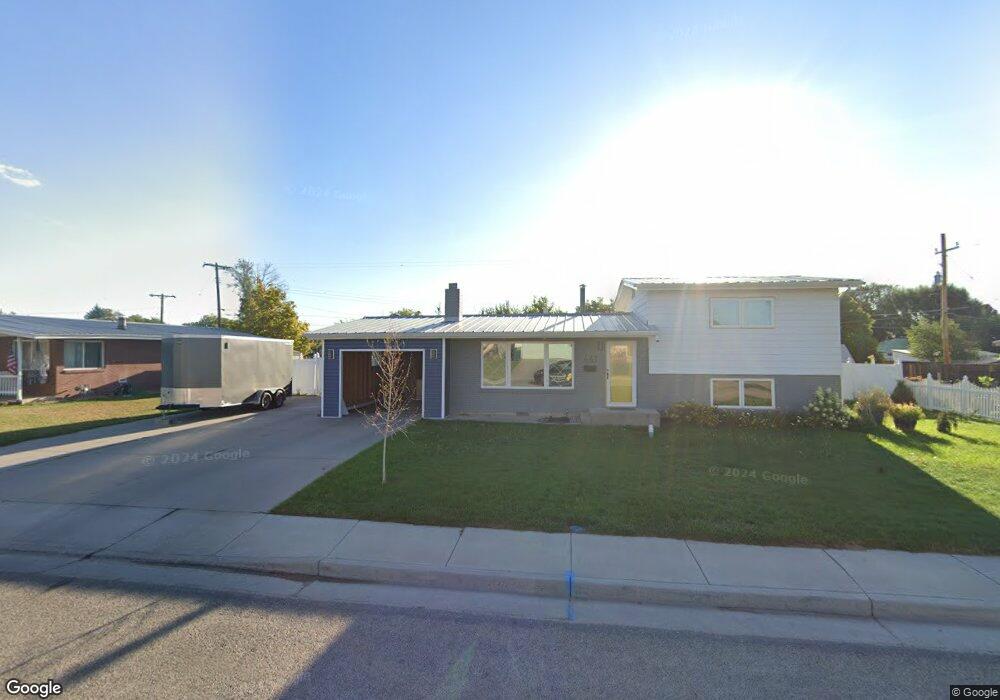
441 S 350 W Vernal, UT 84078
Estimated Value: $314,000 - $383,000
3
Beds
2
Baths
1,964
Sq Ft
$174/Sq Ft
Est. Value
About This Home
This home is located at 441 S 350 W, Vernal, UT 84078 and is currently estimated at $341,427, approximately $173 per square foot. 441 S 350 W is a home located in Uintah County with nearby schools including Discovery School, Vernal Middle School, and Uintah Middle School.
Ownership History
Date
Name
Owned For
Owner Type
Purchase Details
Closed on
Oct 23, 2019
Sold by
Kendall Mark and Kendall Ann M
Bought by
Evans Walker and Evans Hannah
Current Estimated Value
Home Financials for this Owner
Home Financials are based on the most recent Mortgage that was taken out on this home.
Original Mortgage
$122,500
Outstanding Balance
$107,751
Interest Rate
3.7%
Mortgage Type
New Conventional
Estimated Equity
$233,676
Purchase Details
Closed on
Jul 26, 2017
Sold by
Hall Durk B and The Durk Boyd Hall Revocable T
Bought by
Kendall Mark and Kendall Annmarie
Purchase Details
Closed on
Dec 9, 2016
Sold by
Hall Durk B
Bought by
Hall Durk B
Create a Home Valuation Report for This Property
The Home Valuation Report is an in-depth analysis detailing your home's value as well as a comparison with similar homes in the area
Home Values in the Area
Average Home Value in this Area
Purchase History
| Date | Buyer | Sale Price | Title Company |
|---|---|---|---|
| Evans Walker | -- | -- | |
| Kendall Mark | -- | Basin Land Title | |
| Hall Durk B | -- | None Available |
Source: Public Records
Mortgage History
| Date | Status | Borrower | Loan Amount |
|---|---|---|---|
| Open | Evans Walker | $122,500 |
Source: Public Records
Tax History Compared to Growth
Tax History
| Year | Tax Paid | Tax Assessment Tax Assessment Total Assessment is a certain percentage of the fair market value that is determined by local assessors to be the total taxable value of land and additions on the property. | Land | Improvement |
|---|---|---|---|---|
| 2024 | $1,544 | $175,232 | $18,655 | $156,577 |
| 2023 | $1,544 | $139,824 | $18,033 | $121,791 |
| 2022 | $1,247 | $115,466 | $18,033 | $97,433 |
| 2021 | $1,272 | $53,485 | $9,918 | $43,567 |
| 2020 | $1,217 | $95,693 | $18,033 | $77,660 |
| 2019 | $1,161 | $90,078 | $19,250 | $70,828 |
| 2018 | $1,119 | $86,705 | $19,250 | $67,455 |
| 2017 | $11 | $89,455 | $22,000 | $67,455 |
| 2016 | $1,163 | $99,268 | $22,000 | $77,268 |
| 2015 | $1,118 | $103,335 | $22,000 | $81,335 |
| 2014 | $1,062 | $99,462 | $22,000 | $77,462 |
| 2013 | $1,085 | $99,462 | $22,000 | $77,462 |
Source: Public Records
Map
Nearby Homes