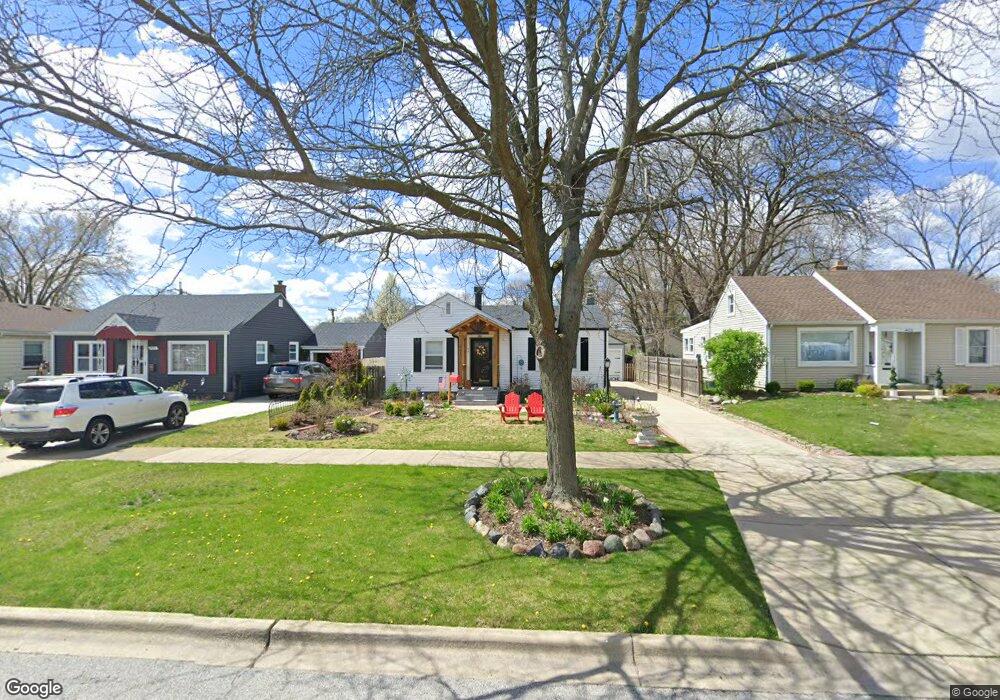
441 S Commonwealth Ave Aurora, IL 60506
University Neighbors NeighborhoodEstimated Value: $259,000 - $282,000
2
Beds
1
Bath
904
Sq Ft
$300/Sq Ft
Est. Value
About This Home
This home is located at 441 S Commonwealth Ave, Aurora, IL 60506 and is currently estimated at $271,100, approximately $299 per square foot. 441 S Commonwealth Ave is a home located in Kane County with nearby schools including Freeman Elementary School, Washington Middle School, and West Aurora High School.
Ownership History
Date
Name
Owned For
Owner Type
Purchase Details
Closed on
Jul 26, 2002
Sold by
Kies Wayne H
Bought by
Djidic Jasmin and Djidic Mileva
Current Estimated Value
Home Financials for this Owner
Home Financials are based on the most recent Mortgage that was taken out on this home.
Original Mortgage
$118,750
Outstanding Balance
$50,500
Interest Rate
6.62%
Estimated Equity
$220,600
Purchase Details
Closed on
Jun 25, 1999
Sold by
Auter Michael W
Bought by
Kies Wayne H
Home Financials for this Owner
Home Financials are based on the most recent Mortgage that was taken out on this home.
Original Mortgage
$101,700
Interest Rate
7.29%
Purchase Details
Closed on
Jun 30, 1997
Sold by
Doyle Peter J and Doyle Heidi C
Bought by
Auter Michael W
Home Financials for this Owner
Home Financials are based on the most recent Mortgage that was taken out on this home.
Original Mortgage
$80,000
Interest Rate
8%
Create a Home Valuation Report for This Property
The Home Valuation Report is an in-depth analysis detailing your home's value as well as a comparison with similar homes in the area
Home Values in the Area
Average Home Value in this Area
Purchase History
| Date | Buyer | Sale Price | Title Company |
|---|---|---|---|
| Djidic Jasmin | $125,000 | First American Title Co | |
| Kies Wayne H | $113,000 | Law Title Insurance Co Inc | |
| Auter Michael W | $100,000 | Inter County Title Co |
Source: Public Records
Mortgage History
| Date | Status | Borrower | Loan Amount |
|---|---|---|---|
| Open | Djidic Jasmin | $118,750 | |
| Previous Owner | Kies Wayne H | $101,700 | |
| Previous Owner | Auter Michael W | $80,000 |
Source: Public Records
Tax History
| Year | Tax Paid | Tax Assessment Tax Assessment Total Assessment is a certain percentage of the fair market value that is determined by local assessors to be the total taxable value of land and additions on the property. | Land | Improvement |
|---|---|---|---|---|
| 2024 | $5,108 | $72,514 | $13,869 | $58,645 |
| 2023 | $4,864 | $64,791 | $12,392 | $52,399 |
| 2022 | $4,702 | $59,116 | $11,307 | $47,809 |
| 2021 | $4,480 | $55,038 | $10,527 | $44,511 |
| 2020 | $4,224 | $51,122 | $9,778 | $41,344 |
| 2019 | $4,193 | $48,880 | $9,060 | $39,820 |
| 2018 | $3,670 | $42,758 | $8,380 | $34,378 |
| 2017 | $3,273 | $37,799 | $7,721 | $30,078 |
| 2016 | $2,978 | $34,031 | $6,618 | $27,413 |
| 2015 | -- | $29,738 | $5,691 | $24,047 |
| 2014 | -- | $29,899 | $5,230 | $24,669 |
| 2013 | -- | $31,099 | $5,261 | $25,838 |
Source: Public Records
Map
Nearby Homes
- 1123 Prairie St
- 527 S Calumet Ave
- 220 S Calumet Ave
- 160 Ingleside Ave
- 175 S Harrison Ave
- 1035 Allaire Ave
- 625 S Lake St
- 231 W Downer Place
- 646-648 Hardin Ave
- 1344 W Galena Blvd
- 140 S Westlawn Ave
- 528 Woodlawn Ave
- 930 W New York St Unit 932
- 810 W Galena Blvd
- 659 W Downer Place
- 170 Alschuler Dr
- 354 Woodlawn Ave
- 706 Sard Ave
- 115 N Western Ave
- 315 S Lake St
- 433 S Commonwealth Ave
- 443 S Commonwealth Ave
- 429 S Commonwealth Ave
- 445 S Commonwealth Ave
- 425 S Commonwealth Ave
- 436 Le Grande Blvd
- 432 Le Grande Blvd
- 440 Le Grande Blvd
- 1147 Prairie St
- 428 Le Grande Blvd
- 421 S Commonwealth Ave
- 1119 Prairie St
- 420 Le Grande Blvd
- 432 S Commonwealth Ave
- 417 S Commonwealth Ave
- 1128 Prairie St
- 1128 Prairie St Unit 102
- 1128 Prairie St Unit A
- 1128 Prairie St Unit A-2
- 424 S Commonwealth Ave
Your Personal Tour Guide
Ask me questions while you tour the home.