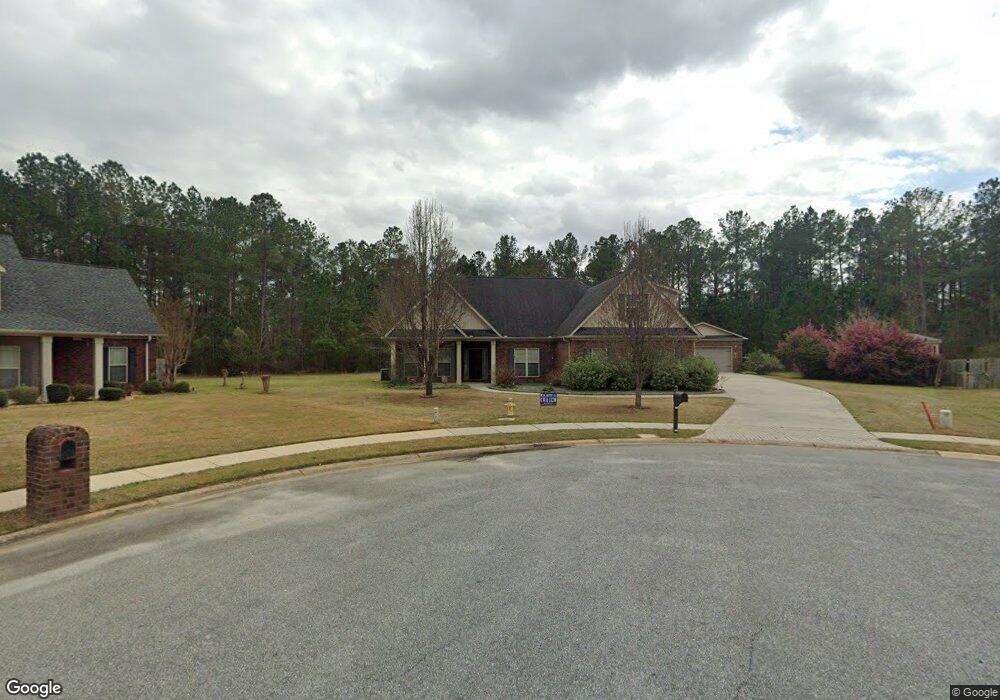
441 Stonecrest Ct Macon, GA 31216
Estimated Value: $295,318 - $357,000
3
Beds
2
Baths
2,427
Sq Ft
$139/Sq Ft
Est. Value
About This Home
This home is located at 441 Stonecrest Ct, Macon, GA 31216 and is currently estimated at $337,580, approximately $139 per square foot. 441 Stonecrest Ct is a home located in Bibb County with nearby schools including Heard Elementary School, Rutland Middle School, and Rutland High School.
Ownership History
Date
Name
Owned For
Owner Type
Purchase Details
Closed on
Aug 29, 2018
Sold by
Chatting Suzanne M
Bought by
Chatting Richard C
Current Estimated Value
Purchase Details
Closed on
Feb 22, 2012
Sold by
Chatting Richard C
Bought by
Chatting Richard C and Chatting Suzanne M
Purchase Details
Closed on
Jan 30, 2009
Sold by
Carreker Development Inc
Bought by
Carreker Construction Inc
Home Financials for this Owner
Home Financials are based on the most recent Mortgage that was taken out on this home.
Original Mortgage
$199,519
Outstanding Balance
$125,901
Interest Rate
5.23%
Mortgage Type
FHA
Estimated Equity
$211,679
Purchase Details
Closed on
Jan 29, 2009
Sold by
Carreker Construction Inc
Bought by
Chatting Richard and Chatting Suzanne M
Home Financials for this Owner
Home Financials are based on the most recent Mortgage that was taken out on this home.
Original Mortgage
$199,519
Outstanding Balance
$125,901
Interest Rate
5.23%
Mortgage Type
FHA
Estimated Equity
$211,679
Create a Home Valuation Report for This Property
The Home Valuation Report is an in-depth analysis detailing your home's value as well as a comparison with similar homes in the area
Home Values in the Area
Average Home Value in this Area
Purchase History
| Date | Buyer | Sale Price | Title Company |
|---|---|---|---|
| Chatting Richard C | -- | None Available | |
| Chatting Richard C | -- | None Available | |
| Chatting Richard C | -- | None Available | |
| Carreker Construction Inc | -- | None Available | |
| Chatting Richard | $203,200 | None Available |
Source: Public Records
Mortgage History
| Date | Status | Borrower | Loan Amount |
|---|---|---|---|
| Open | Chatting Richard | $199,519 |
Source: Public Records
Tax History Compared to Growth
Tax History
| Year | Tax Paid | Tax Assessment Tax Assessment Total Assessment is a certain percentage of the fair market value that is determined by local assessors to be the total taxable value of land and additions on the property. | Land | Improvement |
|---|---|---|---|---|
| 2025 | $2,532 | $103,030 | $10,000 | $93,030 |
| 2024 | $2,617 | $103,030 | $10,000 | $93,030 |
| 2023 | $2,617 | $103,030 | $10,000 | $93,030 |
| 2022 | $3,502 | $101,142 | $12,000 | $89,142 |
| 2021 | $3,337 | $87,822 | $11,400 | $76,422 |
| 2020 | $3,101 | $79,871 | $11,400 | $68,471 |
| 2019 | $3,004 | $76,736 | $11,400 | $65,336 |
| 2018 | $4,780 | $76,736 | $11,400 | $65,336 |
| 2017 | $2,676 | $71,438 | $11,400 | $60,038 |
| 2016 | $2,472 | $71,438 | $11,400 | $60,038 |
| 2015 | $3,498 | $71,438 | $11,400 | $60,038 |
| 2014 | $3,289 | $67,054 | $10,800 | $56,254 |
Source: Public Records
Map
Nearby Homes
- 405 Stonecrest Ct
- 813 Ocala National Trail
- 326 Thoroughbred Ln
- 361 Thoroughbred Ln
- 0 Houston Rd Unit 10572705
- 3676 Jones Rd
- 328 Cody Dr
- 330 Cody Dr
- 3720 Dean Dr
- 318 Cody Dr
- 102 Haylie Ct
- 104 Alayna Ct
- 310 Cody Dr
- Jodeco Plan at Goodall Woods
- Sierra Plan at Goodall Woods
- Poplar Plan at Goodall Woods
- Russell Plan at Goodall Woods
- Clayton Plan at Goodall Woods
- 437 Stonecrest Ct Unit 211
- 437 Stonecrest Ct
- 440 Stonecrest Ct
- 433 Stonecrest Ct
- 436 Stonecrest Ct Unit 208
- 436 Stonecrest Ct
- 432 Stonecrest Ct
- 429 Stonecrest Ct
- 425 Stonecrest Ct
- 424 Stonecrest Ct
- 505 Silver Springs Ct
- 421 Stonecrest Ct
- 509 Silver Springs Ct
- 0 Stonecrest Ct Unit 8429532
- 0 Stonecrest Ct Unit 8055574
- 0 Stonecrest Ct Unit 8080870
- 0 Stonecrest Ct Unit 2639711
- 0 Stonecrest Ct Unit 3043858
- 0 Stonecrest Ct Unit 3121683
- 0 Stonecrest Ct Unit 3179116