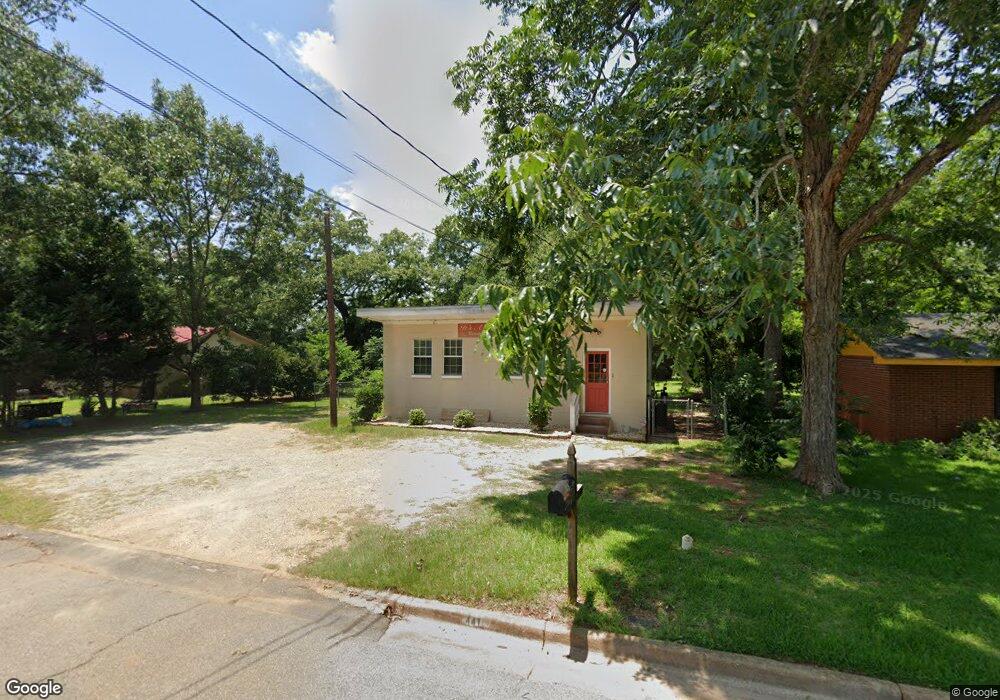
441 Stonewall St SE Dawson, GA 39842
Estimated Value: $58,607
--
Bed
--
Bath
600
Sq Ft
$98/Sq Ft
Est. Value
About This Home
This home is located at 441 Stonewall St SE, Dawson, GA 39842 and is currently estimated at $58,607, approximately $97 per square foot. 441 Stonewall St SE is a home located in Terrell County with nearby schools including Cooper-Carver Elementary School, Terrell Middle School, and Terrell High School.
Ownership History
Date
Name
Owned For
Owner Type
Purchase Details
Closed on
Sep 4, 2009
Sold by
Kendrick Bobbie Lee
Bought by
Kendrick Bobbie Lee and Kendrick Sophia King
Current Estimated Value
Purchase Details
Closed on
Apr 24, 2009
Sold by
Regions Bank
Bought by
Kendrick Bobbie Lee
Purchase Details
Closed on
Dec 2, 2008
Sold by
Regions Bank
Bought by
Regions Bank
Purchase Details
Closed on
Sep 12, 2006
Sold by
Guagliardo Richard D
Bought by
Almeida Matthew and Almeida Jennifer
Home Financials for this Owner
Home Financials are based on the most recent Mortgage that was taken out on this home.
Original Mortgage
$23,702
Interest Rate
6.48%
Mortgage Type
Commercial
Purchase Details
Closed on
Aug 25, 2004
Sold by
Bolton J David
Bought by
Guagliardo Richard D and Guagliardo Connie J
Create a Home Valuation Report for This Property
The Home Valuation Report is an in-depth analysis detailing your home's value as well as a comparison with similar homes in the area
Home Values in the Area
Average Home Value in this Area
Purchase History
| Date | Buyer | Sale Price | Title Company |
|---|---|---|---|
| Kendrick Bobbie Lee | -- | -- | |
| Kendrick Bobbie Lee | $19,500 | -- | |
| Regions Bank | -- | -- | |
| Almeida Matthew | $27,900 | -- | |
| Guagliardo Richard D | $5,000 | -- |
Source: Public Records
Mortgage History
| Date | Status | Borrower | Loan Amount |
|---|---|---|---|
| Previous Owner | Almeida Matthew | $23,702 |
Source: Public Records
Tax History Compared to Growth
Tax History
| Year | Tax Paid | Tax Assessment Tax Assessment Total Assessment is a certain percentage of the fair market value that is determined by local assessors to be the total taxable value of land and additions on the property. | Land | Improvement |
|---|---|---|---|---|
| 2024 | $700 | $16,281 | $10,500 | $5,781 |
| 2023 | $700 | $16,281 | $10,500 | $5,781 |
| 2022 | $504 | $16,281 | $10,500 | $5,781 |
| 2021 | $504 | $16,281 | $10,500 | $5,781 |
| 2020 | $504 | $16,281 | $10,500 | $5,781 |
| 2019 | $488 | $16,281 | $10,500 | $5,781 |
| 2018 | $488 | $16,281 | $10,500 | $5,781 |
| 2017 | $620 | $16,281 | $10,500 | $5,781 |
| 2016 | $488 | $16,281 | $10,500 | $5,781 |
| 2015 | -- | $16,281 | $10,500 | $5,781 |
| 2014 | -- | $16,281 | $10,500 | $5,781 |
| 2013 | -- | $16,281 | $10,500 | $5,781 |
Source: Public Records
Map
Nearby Homes
- 0 Cox Rd
- 411 E Lee St
- 707 Johnson St SE
- 439 Cherry St SE
- 229 7th Ave NW
- 527 Orange St NE
- 361/552 NW Tenth Ave
- 513 College St NE
- 1266 Georgia Ave SE
- 13XX Graves Hwy
- 0 Elladale Dr SE Unit 18754943
- 1240 Askew Dr NE
- 1258 Askew Dr NE
- 904 Ash St NE
- 828 Cooper Dr NE
- 0 Cooper Dr NE Unit 7597500
- 0 Cooper Dr NE Unit 10543060
- 434 Foster Ave
- 1239 Askew Dr NE
- 1256 Ball Park Ave NE
- 437 Stonewall St SE
- 451 Stonewall St SE
- 431 Stonewall St SE
- 448 Stonewall St SE
- 442 Stonewall St SE
- 457 Stonewall St SE
- 436 Stonewall St SE
- 425 Stonewall St SE
- 430 Stonewall St SE
- 438 S Main St
- 463 Stonewall St SE
- 434 S Main St
- 542 Orange St SE
- 424 Stonewall St SE
- 417 Stonewall St SE
- 467 Stonewall St SE
- 215 Cedar Hill Ave SE
- 526 Orange St SE
- 271 Cedar Hill Ave SE
- 418 Stonewall St SE