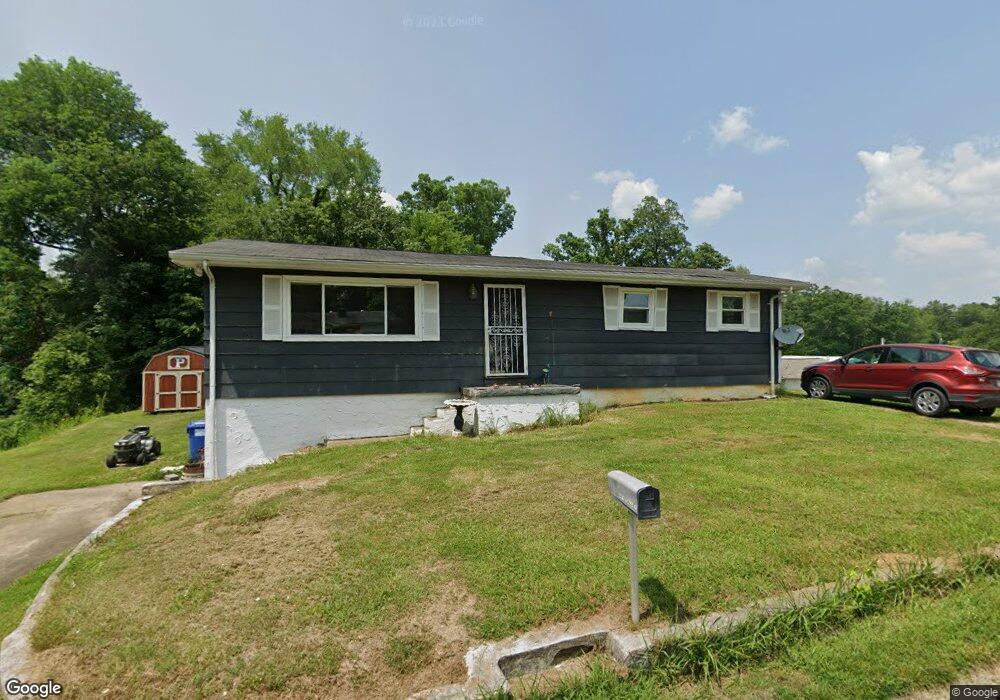
441 Talley Ave Rossville, GA 30741
Estimated Value: $183,033 - $272,000
--
Bed
2
Baths
1,636
Sq Ft
$143/Sq Ft
Est. Value
About This Home
This home is located at 441 Talley Ave, Rossville, GA 30741 and is currently estimated at $233,758, approximately $142 per square foot. 441 Talley Ave is a home located in Walker County with nearby schools including Chattanooga Valley Elementary School, Chattanooga Valley Middle School, and Ridgeland High School.
Ownership History
Date
Name
Owned For
Owner Type
Purchase Details
Closed on
Feb 1, 2018
Sold by
Broom Jeanette J
Bought by
Pittman Randall R and Pittman Regina A
Current Estimated Value
Purchase Details
Closed on
Mar 30, 1984
Sold by
Jackson Rex
Bought by
Broom James V and Broom Jeanette
Purchase Details
Closed on
Mar 2, 1983
Sold by
Secretary Of Hud
Bought by
Jackson Rex
Purchase Details
Closed on
Jul 8, 1982
Sold by
National Mortgage Co
Bought by
Secretary Of Hud
Purchase Details
Closed on
Jul 6, 1982
Sold by
Painter Pierce R and Linda Sue
Bought by
National Mortgage Co
Purchase Details
Closed on
Jul 21, 1981
Sold by
Federal National Morg Assoc
Bought by
Painter Pierce R and Linda Sue
Purchase Details
Closed on
Jul 11, 1980
Bought by
Secretary Of Hud
Create a Home Valuation Report for This Property
The Home Valuation Report is an in-depth analysis detailing your home's value as well as a comparison with similar homes in the area
Home Values in the Area
Average Home Value in this Area
Purchase History
| Date | Buyer | Sale Price | Title Company |
|---|---|---|---|
| Pittman Randall R | -- | -- | |
| Broom James V | -- | -- | |
| Jackson Rex | -- | -- | |
| Secretary Of Hud | -- | -- | |
| National Mortgage Co | -- | -- | |
| Painter Pierce R | -- | -- | |
| Secretary Of Hud | -- | -- | |
| Federal National Morg Assoc | -- | -- |
Source: Public Records
Tax History Compared to Growth
Tax History
| Year | Tax Paid | Tax Assessment Tax Assessment Total Assessment is a certain percentage of the fair market value that is determined by local assessors to be the total taxable value of land and additions on the property. | Land | Improvement |
|---|---|---|---|---|
| 2024 | $1,428 | $61,028 | $6,451 | $54,577 |
| 2023 | $1,377 | $57,406 | $5,760 | $51,646 |
| 2022 | $1,242 | $48,380 | $4,020 | $44,360 |
| 2021 | $1,179 | $39,486 | $4,020 | $35,466 |
| 2020 | $1,049 | $33,171 | $4,020 | $29,151 |
| 2019 | $1,066 | $33,171 | $4,020 | $29,151 |
| 2018 | $878 | $33,171 | $4,020 | $29,151 |
| 2017 | $1,004 | $28,076 | $4,020 | $24,056 |
| 2016 | $817 | $28,076 | $4,020 | $24,056 |
| 2015 | $782 | $27,034 | $3,480 | $23,554 |
| 2014 | $697 | $27,034 | $3,480 | $23,554 |
| 2013 | -- | $27,033 | $3,480 | $23,553 |
Source: Public Records
Map
Nearby Homes
- 880 Dry Valley Rd
- 18 Buck Creek Ln
- 89 Oak Ct
- 34 And 38 East Ave
- 3438 East Ave
- 306 Dry Valley Rd
- 278 Dry Valley Rd
- 76 Saddlebred Way
- 0 Dry Valley Rd Unit 1507680
- 1308 Dry Valley Rd
- 256 Cascade Dr
- 242 Cascade Dr
- 107 Cascade Dr
- 4302 Happy Valley Rd
- 30 Talley Hill Ln
- 114 Saddlebred Way
- 115 Saddlebred Way
- 0 W Schmidt Rd Unit 1507496
- 184 Cinderella Dr