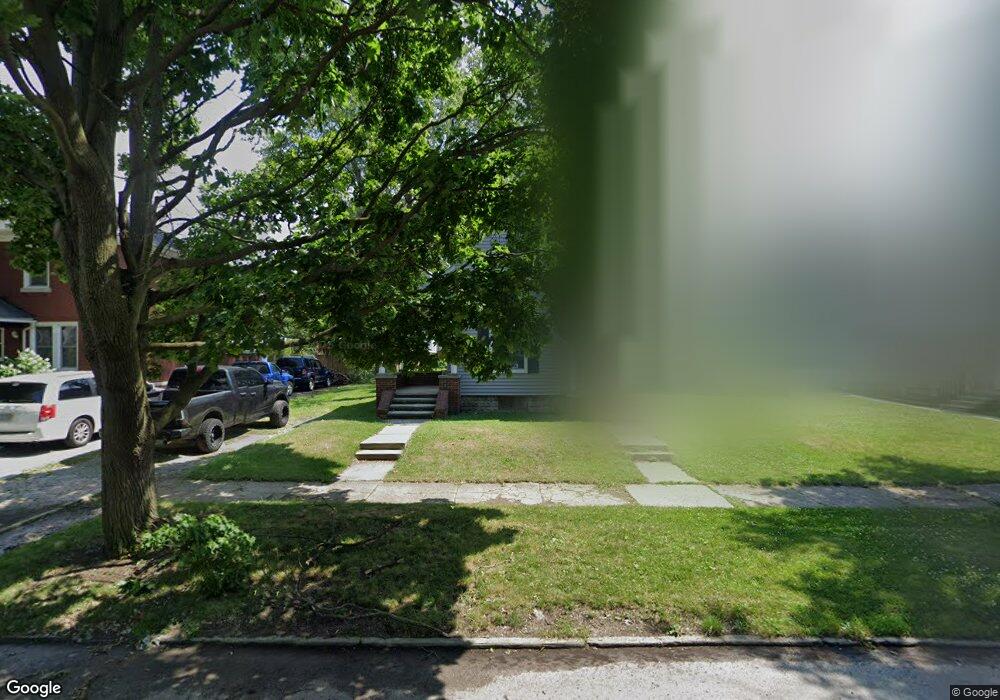
441 W Fremont St Unit 441 1/2 Fostoria, OH 44830
Estimated Value: $109,000 - $126,141
4
Beds
2
Baths
1,808
Sq Ft
$65/Sq Ft
Est. Value
About This Home
This home is located at 441 W Fremont St Unit 441 1/2, Fostoria, OH 44830 and is currently estimated at $118,035, approximately $65 per square foot. 441 W Fremont St Unit 441 1/2 is a home located in Seneca County with nearby schools including Fostoria Intermediate Elementary School and Fostoria Junior/Senior High School.
Ownership History
Date
Name
Owned For
Owner Type
Purchase Details
Closed on
Feb 22, 2024
Sold by
Veezy Inv Properties Llc
Bought by
J & P Verhoff Enterprises Inc
Current Estimated Value
Purchase Details
Closed on
Oct 6, 2022
Sold by
Rilyn Properties Llc
Bought by
Veezy Investment Properties Llc
Purchase Details
Closed on
May 20, 2020
Sold by
Schmitz Jeffrey A
Bought by
Rilyn Properties Llc
Purchase Details
Closed on
Dec 23, 2015
Sold by
Rowe Steven E and Markey Rowe Colleen E
Bought by
Schmitz Jeffrey A
Home Financials for this Owner
Home Financials are based on the most recent Mortgage that was taken out on this home.
Original Mortgage
$16,250
Interest Rate
3.96%
Mortgage Type
New Conventional
Purchase Details
Closed on
Dec 1, 1986
Purchase Details
Closed on
Mar 1, 1986
Create a Home Valuation Report for This Property
The Home Valuation Report is an in-depth analysis detailing your home's value as well as a comparison with similar homes in the area
Home Values in the Area
Average Home Value in this Area
Purchase History
| Date | Buyer | Sale Price | Title Company |
|---|---|---|---|
| J & P Verhoff Enterprises Inc | $310,000 | Whitman Title | |
| Veezy Investment Properties Llc | $200,000 | Whitman Title | |
| Rilyn Properties Llc | $25,000 | Wolph Title Inc | |
| Schmitz Jeffrey A | $25,000 | Legacy Title | |
| -- | $31,000 | -- | |
| -- | $29,000 | -- |
Source: Public Records
Mortgage History
| Date | Status | Borrower | Loan Amount |
|---|---|---|---|
| Previous Owner | Schmitz Jeffrey A | $16,250 |
Source: Public Records
Tax History Compared to Growth
Tax History
| Year | Tax Paid | Tax Assessment Tax Assessment Total Assessment is a certain percentage of the fair market value that is determined by local assessors to be the total taxable value of land and additions on the property. | Land | Improvement |
|---|---|---|---|---|
| 2024 | $1,511 | $29,360 | $4,490 | $24,870 |
| 2023 | $1,514 | $29,360 | $4,490 | $24,870 |
| 2022 | $1,369 | $23,650 | $4,180 | $19,470 |
| 2021 | $1,398 | $23,650 | $4,180 | $19,470 |
| 2020 | $1,405 | $23,654 | $4,183 | $19,471 |
| 2019 | $1,237 | $20,668 | $3,745 | $16,923 |
| 2018 | $1,261 | $20,668 | $3,745 | $16,923 |
| 2017 | $1,260 | $20,668 | $3,745 | $16,923 |
| 2016 | $1,019 | $18,670 | $3,903 | $14,767 |
| 2015 | $978 | $18,670 | $3,903 | $14,767 |
| 2014 | $930 | $18,670 | $3,903 | $14,767 |
| 2013 | $1,094 | $20,293 | $4,242 | $16,051 |
Source: Public Records
Map
Nearby Homes
- 203 N Union St
- 520 N Union St
- 509 College Ave
- 723 N Union St
- 348 W South St
- 351 W South St
- 211 Summit St
- 603 N Vine St
- 0 W South Route 12
- 633 Maple St
- 540 N Poplar St
- 321 Mcdougal St
- 931 N Union St
- 892 N Countyline St
- 900 N Countyline St
- 435 Park Ave
- 901 Central Ave
- 207 W Culbertson St
- 412 E Center St
- 727 Eisenhower Dr
- 447 W Fremont St
- 435 W Fremont St
- 447 W Fremont St
- 457 Fremont Dr
- 451 W Fremont St
- 427 W Fremont St
- 318 N Countyline St
- 457 W Fremont St
- 324 N Countyline St
- 441-441 1/2 Fremont
- 421 W Fremont St
- 432 W Fremont St
- 338 College Ave
- 312 N Countyline St
- 446 Fremont Dr
- 332 College Ave
- 452 Fremont Dr
- 438 W Fremont St
- 326 College Ave
- 415 W Fremont St