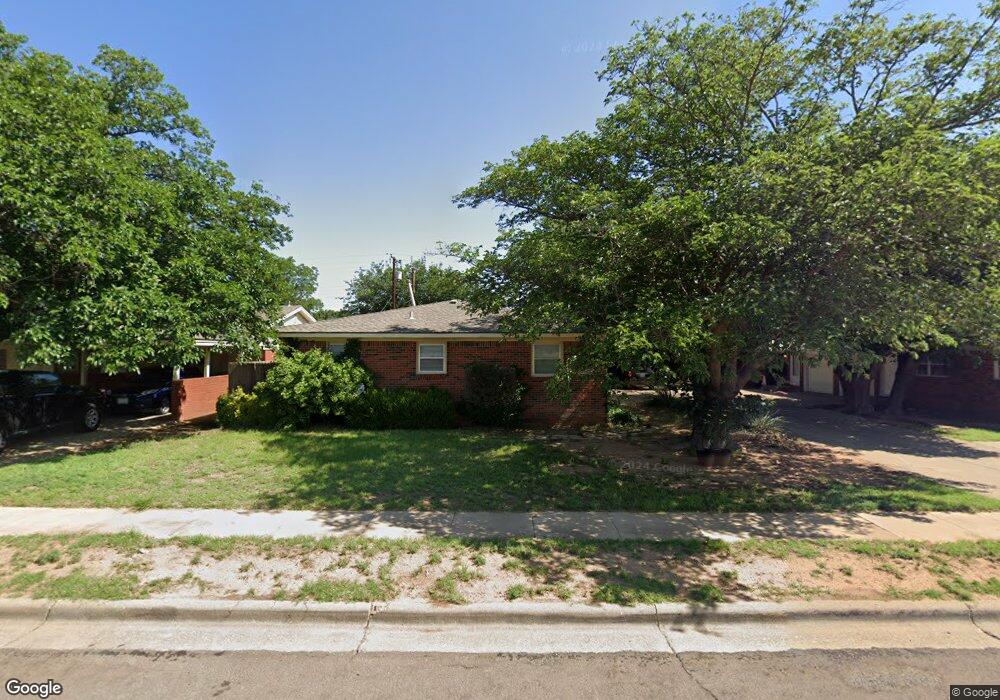
4410 29th St Lubbock, TX 79410
Coronado NeighborhoodEstimated Value: $158,000 - $260,013
4
Beds
2
Baths
1,949
Sq Ft
$97/Sq Ft
Est. Value
About This Home
This home is located at 4410 29th St, Lubbock, TX 79410 and is currently estimated at $190,003, approximately $97 per square foot. 4410 29th St is a home located in Lubbock County with nearby schools including Overton Elementary School, Commander William C. McCool Academy, and Mackenzie Middle School.
Ownership History
Date
Name
Owned For
Owner Type
Purchase Details
Closed on
Mar 12, 2021
Sold by
Borhani Marcus and Kelley Dawn
Bought by
Dynamo Plains Holdings Llc
Current Estimated Value
Home Financials for this Owner
Home Financials are based on the most recent Mortgage that was taken out on this home.
Original Mortgage
$140,000
Outstanding Balance
$103,770
Interest Rate
2.7%
Mortgage Type
Commercial
Estimated Equity
$86,233
Purchase Details
Closed on
Dec 21, 2015
Sold by
Stairs Vern W and Stairs Kim A
Bought by
Borhani Marcus and Kelley Dawn
Purchase Details
Closed on
Sep 22, 1999
Sold by
Brockman Joan
Bought by
Borhani Marcus and Dawn Kelley
Purchase Details
Closed on
Jan 17, 1995
Sold by
Brockman Joan
Bought by
Borhani Marcus and Dawn Kelley
Create a Home Valuation Report for This Property
The Home Valuation Report is an in-depth analysis detailing your home's value as well as a comparison with similar homes in the area
Home Values in the Area
Average Home Value in this Area
Purchase History
| Date | Buyer | Sale Price | Title Company |
|---|---|---|---|
| Dynamo Plains Holdings Llc | -- | Hub City Bank | |
| Borhani Marcus | -- | Service Title | |
| Borhani Marcus | -- | -- | |
| Borhani Marcus | -- | -- |
Source: Public Records
Mortgage History
| Date | Status | Borrower | Loan Amount |
|---|---|---|---|
| Open | Dynamo Plains Holdings Llc | $140,000 |
Source: Public Records
Tax History Compared to Growth
Tax History
| Year | Tax Paid | Tax Assessment Tax Assessment Total Assessment is a certain percentage of the fair market value that is determined by local assessors to be the total taxable value of land and additions on the property. | Land | Improvement |
|---|---|---|---|---|
| 2025 | $2,980 | $157,653 | $30,000 | $127,653 |
| 2024 | $2,980 | $177,667 | $30,000 | $147,667 |
| 2023 | $3,282 | $176,565 | $15,625 | $160,940 |
| 2022 | $3,574 | $176,565 | $15,625 | $160,940 |
| 2021 | $1,853 | $86,516 | $15,625 | $70,891 |
| 2020 | $1,881 | $86,516 | $15,625 | $70,891 |
| 2019 | $1,942 | $86,516 | $15,625 | $70,891 |
| 2018 | $1,945 | $86,516 | $15,625 | $70,891 |
| 2017 | $1,947 | $86,516 | $15,625 | $70,891 |
| 2016 | $1,976 | $87,808 | $9,375 | $78,433 |
| 2015 | $1,761 | $87,534 | $9,375 | $78,159 |
| 2014 | $1,761 | $87,534 | $9,375 | $78,159 |
Source: Public Records
Map
Nearby Homes