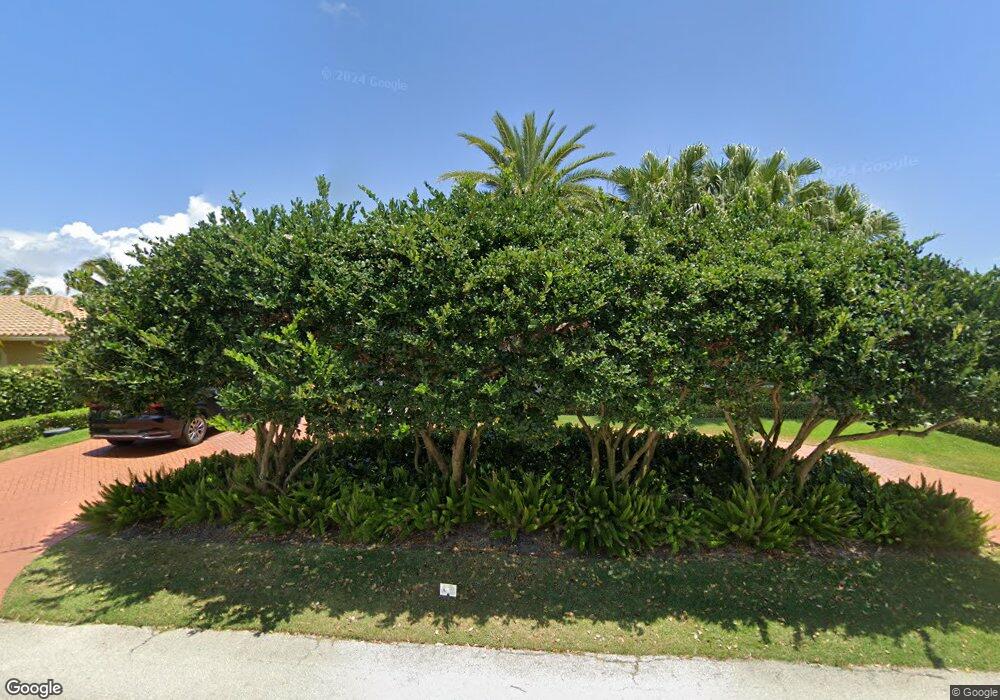
4410 NE 30th Terrace Lighthouse Point, FL 33064
Estimated Value: $1,164,296 - $1,543,000
3
Beds
3
Baths
2,859
Sq Ft
$453/Sq Ft
Est. Value
About This Home
This home is located at 4410 NE 30th Terrace, Lighthouse Point, FL 33064 and is currently estimated at $1,293,824, approximately $452 per square foot. 4410 NE 30th Terrace is a home located in Broward County with nearby schools including Norcrest Elementary School, Deerfield Beach Middle School, and Deerfield Beach High School.
Ownership History
Date
Name
Owned For
Owner Type
Purchase Details
Closed on
Feb 15, 2013
Sold by
Moore Frank and Moore Rosemary
Bought by
Ilardi Salvatore and Ilardi Anne
Current Estimated Value
Home Financials for this Owner
Home Financials are based on the most recent Mortgage that was taken out on this home.
Original Mortgage
$325,000
Outstanding Balance
$227,403
Interest Rate
3.43%
Mortgage Type
New Conventional
Estimated Equity
$1,066,421
Purchase Details
Closed on
Sep 30, 2010
Sold by
Moore Rosemary and Moore Frank
Bought by
Moore Frank and Moore Rosemary
Purchase Details
Closed on
Jun 20, 2007
Sold by
Scott Carol W
Bought by
Moore Rosemary
Purchase Details
Closed on
Aug 11, 1995
Sold by
Stuart Janet and Peschio Janet
Bought by
Scott Wallace R and Scott Carol W
Home Financials for this Owner
Home Financials are based on the most recent Mortgage that was taken out on this home.
Original Mortgage
$156,000
Interest Rate
7.42%
Create a Home Valuation Report for This Property
The Home Valuation Report is an in-depth analysis detailing your home's value as well as a comparison with similar homes in the area
Home Values in the Area
Average Home Value in this Area
Purchase History
| Date | Buyer | Sale Price | Title Company |
|---|---|---|---|
| Ilardi Salvatore | $435,000 | Attorney | |
| Moore Frank | -- | Attorney | |
| Moore Rosemary | $670,000 | Integrity Title Inc | |
| Scott Wallace R | $195,000 | -- |
Source: Public Records
Mortgage History
| Date | Status | Borrower | Loan Amount |
|---|---|---|---|
| Open | Ilardi Salvatore | $325,000 | |
| Previous Owner | Scott Wallace R | $156,000 |
Source: Public Records
Tax History Compared to Growth
Tax History
| Year | Tax Paid | Tax Assessment Tax Assessment Total Assessment is a certain percentage of the fair market value that is determined by local assessors to be the total taxable value of land and additions on the property. | Land | Improvement |
|---|---|---|---|---|
| 2025 | $17,366 | $874,560 | -- | -- |
| 2024 | $15,611 | $874,560 | -- | -- |
| 2023 | $15,611 | $722,790 | $0 | $0 |
| 2022 | $13,566 | $657,090 | $0 | $0 |
| 2021 | $11,745 | $597,360 | $108,000 | $489,360 |
| 2020 | $10,861 | $553,200 | $108,000 | $445,200 |
| 2019 | $10,954 | $555,080 | $108,000 | $447,080 |
| 2018 | $10,636 | $559,770 | $108,000 | $451,770 |
| 2017 | $9,825 | $508,640 | $0 | $0 |
| 2016 | $9,417 | $462,400 | $0 | $0 |
| 2015 | $8,212 | $419,810 | $0 | $0 |
| 2014 | $7,980 | $400,200 | $0 | $0 |
| 2013 | -- | $463,590 | $72,000 | $391,590 |
Source: Public Records
Map
Nearby Homes
- 4460 NE 31st Ave
- 2840 NE 44th St
- 3100 NE 46th St
- 1091 Hillsboro Mile
- 2901 NE 46th St
- 3020 NE 47th St
- 4121 NE 31st Ave
- 4431 NE 28th Ave
- 2750 NE 45th St
- 2901 NE 47th St
- 4220 NE 27th Ave
- 2921 NE 42nd St Unit 4B
- 2713 NE 42nd St Unit 2713
- 3150 NE 48th Ct Unit 107
- 4451 NE 27th Terrace
- 2751 NE 46th St
- 1069 Hillsboro Mile Unit 705
- 1069 Hillsboro Mile Unit 308
- 3050 NE 48th Ct Unit 303
- 3050 NE 48th Ct Unit 402
- 4420 NE 30th Terrace
- 4400 NE 30th Terrace
- 4411 NE 31st Ave
- 4401 NE 31st Ave
- 4411 NE 30th Terrace
- 4421 NE 31st Ave
- 4421 NE 30th Terrace
- 4430 NE 30th Terrace
- 4401 NE 30th Terrace
- 4431 NE 31st Ave
- 4431 NE 30th Terrace
- 4410 NE 30th Ave
- 3040 NE 44th St
- 4440 NE 30th Terrace
- 4400 NE 30th Ave
- 3020 NE 44th St
- 4430 NE 30th Ave
- 4441 NE 30th Terrace
- 4441 NE 31st Ave