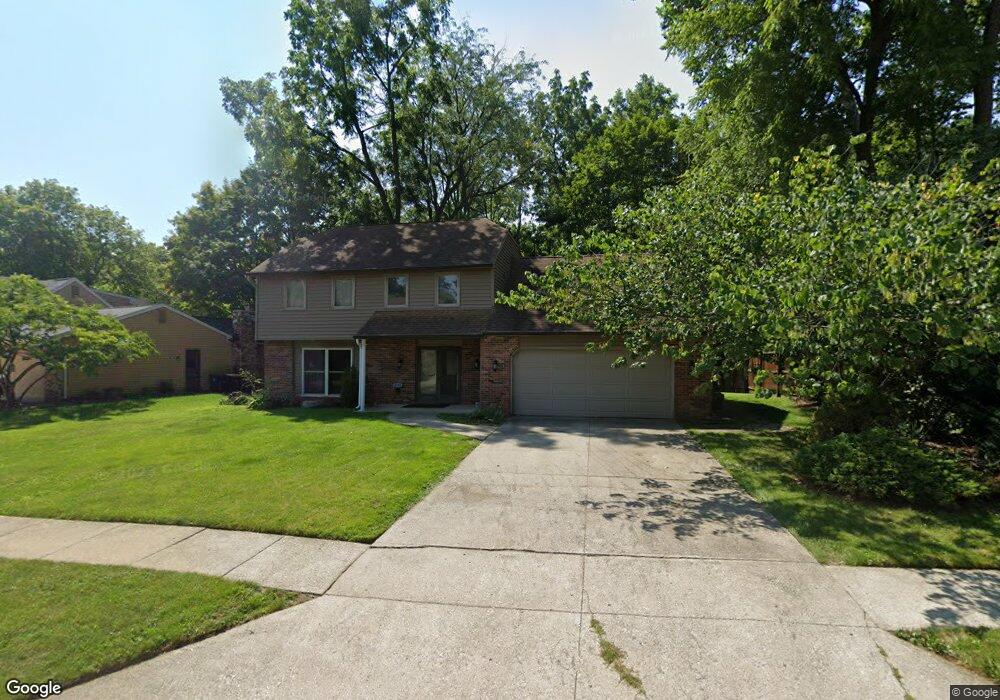
4410 Winding Way Dr Fort Wayne, IN 46835
Brookside-Parkerdale NeighborhoodEstimated Value: $257,000 - $280,665
3
Beds
3
Baths
2,132
Sq Ft
$128/Sq Ft
Est. Value
About This Home
This home is located at 4410 Winding Way Dr, Fort Wayne, IN 46835 and is currently estimated at $273,166, approximately $128 per square foot. 4410 Winding Way Dr is a home located in Allen County with nearby schools including Willard Shambaugh Elementary School, Jefferson Middle School, and Northrop High School.
Ownership History
Date
Name
Owned For
Owner Type
Purchase Details
Closed on
Apr 3, 2008
Sold by
Geise Gregory M and Geise Denise
Bought by
Law Adam R and Law Jaratsri
Current Estimated Value
Home Financials for this Owner
Home Financials are based on the most recent Mortgage that was taken out on this home.
Original Mortgage
$118,047
Outstanding Balance
$76,132
Interest Rate
6.32%
Mortgage Type
FHA
Estimated Equity
$197,034
Purchase Details
Closed on
Aug 18, 2006
Sold by
Hud
Bought by
Geise Denise and Geise Gregory M
Home Financials for this Owner
Home Financials are based on the most recent Mortgage that was taken out on this home.
Original Mortgage
$105,000
Interest Rate
6.88%
Mortgage Type
Purchase Money Mortgage
Purchase Details
Closed on
Apr 10, 2006
Sold by
Citimortgage Inc
Bought by
Hud
Purchase Details
Closed on
Mar 16, 2006
Sold by
Reed John D and Reed Terri J
Bought by
Citimortgage Inc and First Nationwide Mortgage Corp
Create a Home Valuation Report for This Property
The Home Valuation Report is an in-depth analysis detailing your home's value as well as a comparison with similar homes in the area
Home Values in the Area
Average Home Value in this Area
Purchase History
| Date | Buyer | Sale Price | Title Company |
|---|---|---|---|
| Law Adam R | -- | Riverbend Title | |
| Geise Denise | -- | Village Title Inc | |
| Hud | -- | None Available | |
| Citimortgage Inc | $124,411 | None Available |
Source: Public Records
Mortgage History
| Date | Status | Borrower | Loan Amount |
|---|---|---|---|
| Open | Law Adam R | $118,047 | |
| Previous Owner | Geise Denise | $105,000 |
Source: Public Records
Tax History Compared to Growth
Tax History
| Year | Tax Paid | Tax Assessment Tax Assessment Total Assessment is a certain percentage of the fair market value that is determined by local assessors to be the total taxable value of land and additions on the property. | Land | Improvement |
|---|---|---|---|---|
| 2024 | $2,421 | $241,100 | $42,500 | $198,600 |
| 2023 | $2,421 | $213,700 | $42,500 | $171,200 |
| 2022 | $2,274 | $202,800 | $42,500 | $160,300 |
| 2021 | $1,978 | $177,800 | $31,600 | $146,200 |
| 2020 | $1,876 | $172,600 | $31,600 | $141,000 |
| 2019 | $1,697 | $157,300 | $31,600 | $125,700 |
| 2018 | $1,581 | $146,100 | $31,600 | $114,500 |
| 2017 | $1,453 | $133,700 | $31,600 | $102,100 |
| 2016 | $1,379 | $128,700 | $31,600 | $97,100 |
| 2014 | $1,333 | $129,500 | $31,600 | $97,900 |
| 2013 | $1,272 | $123,800 | $31,600 | $92,200 |
Source: Public Records
Map
Nearby Homes
- 4323 River Bluff Dr
- 4655 Northwest Dr Unit A & B
- 4711 Northwest Dr
- 4734 Willow Brook Dr
- 5032 Rothman Rd
- 5102 Ann Hackley Rd
- 6914 Bradford Dr
- 5615 Graber Dr
- 8025 Sunny Ln
- 5614 Kipling Ct
- 7702 Sunderland Dr
- 7028 Salge Dr
- 5625 Mirando Dr
- 4731 Evard Rd
- 7510 Sunderland Dr
- 4314 Osiris Ln
- 8314 Sunny Ln
- 4319 Veritas Blvd
- 8689 Artemis Ln
- 4302 Osiris Ln
- 4420 Winding Way Dr
- 4402 Winding Way Dr
- 4502 Winding Way Dr
- 4330 Winding Way Dr
- 4403 Winding Way Dr
- 4413 Winding Way Dr
- 4510 Winding Way Dr
- 4423 Winding Way Dr
- 4324 Winding Way Dr
- 4501 Winding Way Dr
- 7406 Clingmans Trail
- 4325 Winding Way Dr
- 4528 Winding Way Dr
- 7305 River Ranch Ct
- 7309 River Ranch Ct
- 4505 Winding Way Dr
- 7405 Clingmans Trail
- 7412 Clingmans Trail
- 7236 River Ranch Ct
- 4318 Winding Way Dr