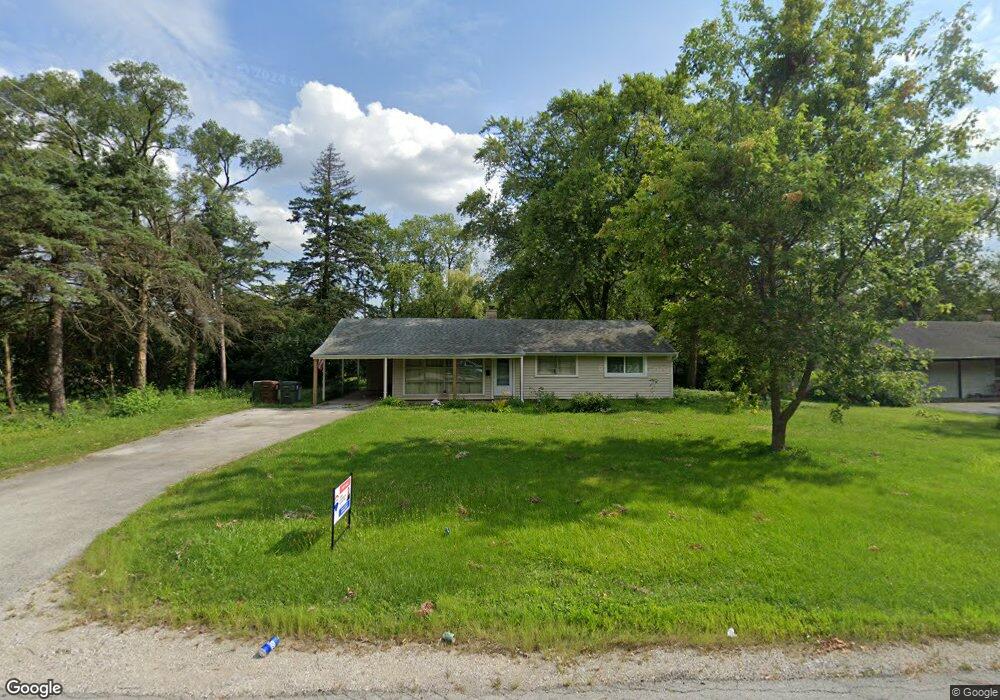
4411 179th St Country Club Hills, IL 60478
Estimated Value: $127,000 - $205,242
3
Beds
1
Bath
1,154
Sq Ft
$143/Sq Ft
Est. Value
About This Home
This home is located at 4411 179th St, Country Club Hills, IL 60478 and is currently estimated at $165,311, approximately $143 per square foot. 4411 179th St is a home located in Cook County with nearby schools including Zenon J Sykuta School, Meadowview Intermediate School, and Southwood Middle School.
Ownership History
Date
Name
Owned For
Owner Type
Purchase Details
Closed on
Aug 20, 2025
Sold by
Havlicek Julia Ann
Bought by
Blackrock Cf6 Ltd
Current Estimated Value
Home Financials for this Owner
Home Financials are based on the most recent Mortgage that was taken out on this home.
Original Mortgage
$185,000
Outstanding Balance
$148,412
Interest Rate
6.72%
Mortgage Type
Construction
Estimated Equity
$16,899
Purchase Details
Closed on
Jul 2, 2018
Sold by
Haque Rose A
Bought by
Havlicek Julia A
Purchase Details
Closed on
Aug 26, 2003
Sold by
Cannizzo Charles R and Weber Sandra L
Bought by
Havlicek Julia A and Haque Rose A
Home Financials for this Owner
Home Financials are based on the most recent Mortgage that was taken out on this home.
Original Mortgage
$103,530
Interest Rate
6.33%
Mortgage Type
FHA
Create a Home Valuation Report for This Property
The Home Valuation Report is an in-depth analysis detailing your home's value as well as a comparison with similar homes in the area
Home Values in the Area
Average Home Value in this Area
Purchase History
| Date | Buyer | Sale Price | Title Company |
|---|---|---|---|
| Blackrock Cf6 Ltd | $103,000 | None Listed On Document | |
| Havlicek Julia A | -- | None Available | |
| Havlicek Julia A | $105,000 | Stewart Title |
Source: Public Records
Mortgage History
| Date | Status | Borrower | Loan Amount |
|---|---|---|---|
| Open | Blackrock Cf6 Ltd | $185,000 | |
| Previous Owner | Havlicek Julia A | $103,530 |
Source: Public Records
Tax History Compared to Growth
Tax History
| Year | Tax Paid | Tax Assessment Tax Assessment Total Assessment is a certain percentage of the fair market value that is determined by local assessors to be the total taxable value of land and additions on the property. | Land | Improvement |
|---|---|---|---|---|
| 2024 | $4,001 | $14,000 | $7,000 | $7,000 |
| 2023 | $1,078 | $14,000 | $7,000 | $7,000 |
| 2022 | $1,078 | $9,159 | $6,000 | $3,159 |
| 2021 | $4,134 | $9,159 | $6,000 | $3,159 |
| 2020 | $4,368 | $9,159 | $6,000 | $3,159 |
| 2019 | $7,019 | $9,511 | $5,500 | $4,011 |
| 2018 | $6,709 | $9,511 | $5,500 | $4,011 |
| 2017 | $1,047 | $9,511 | $5,500 | $4,011 |
| 2016 | $2,806 | $8,423 | $5,000 | $3,423 |
| 2015 | $2,586 | $8,423 | $5,000 | $3,423 |
| 2014 | $2,601 | $8,423 | $5,000 | $3,423 |
| 2013 | $3,869 | $9,255 | $5,000 | $4,255 |
Source: Public Records
Map
Nearby Homes
- 4421 179th St
- 18038 Juneway Ct
- 4411 177th Place
- 18057 Juneway Ct
- 17925 John Ave
- 18109 Idlewild Dr
- 18115 Idlewild Dr
- 17942 Edwards Ave
- 18207 Ravisloe Terrace
- 18037 Edwards Ave
- 17940 Michael Ave
- 4207 176th Place
- 17975 Huntleigh Ct Unit 301
- 17963 Huntleigh Ct Unit 302
- 18010 Olympia Dr
- 4200 W 176th Place
- 4061 177th St
- 4656 176th Place
- 4240 176th St
- 17975 Amherst Ct Unit 301