Estimated Value: $288,000 - $461,000
3
Beds
3
Baths
2,095
Sq Ft
$182/Sq Ft
Est. Value
About This Home
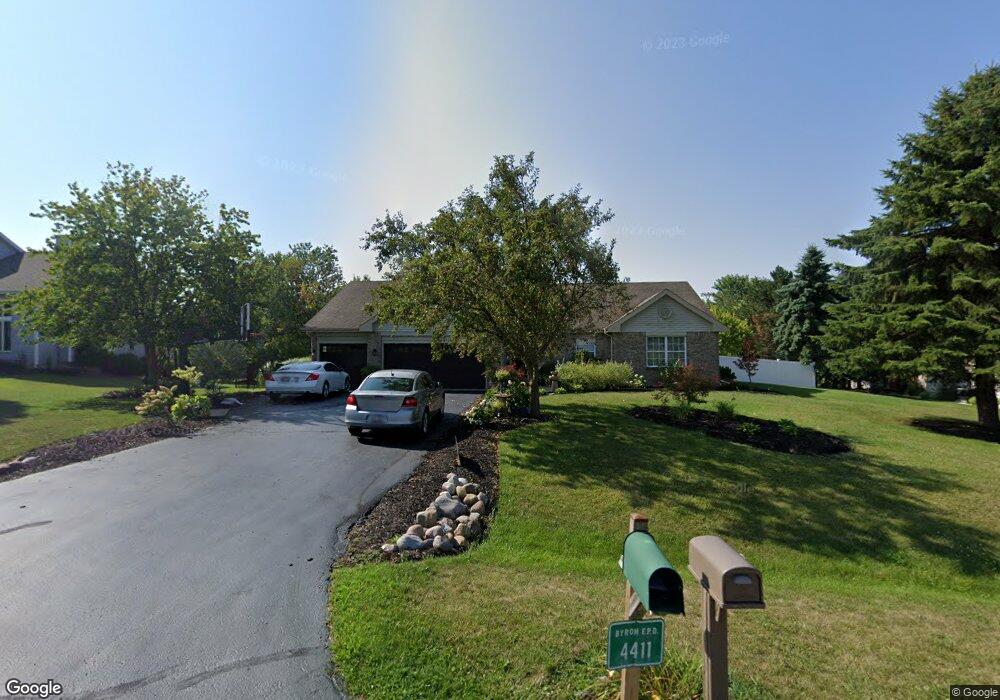
This home is located at 4411 E Cascio Dr, Byron, IL 61010 and is currently estimated at $381,546, approximately $182 per square foot. 4411 E Cascio Dr is a home located in Ogle County with nearby schools including Mary Morgan Elementary School, Byron Middle School, and Byron High School.
Ownership History
Date
Name
Owned For
Owner Type
Purchase Details
Closed on
Sep 24, 2014
Sold by
Bielskis Kristyn Marie
Bought by
Bielskis Raymond J
Current Estimated Value
Home Financials for this Owner
Home Financials are based on the most recent Mortgage that was taken out on this home.
Original Mortgage
$164,900
Outstanding Balance
$125,914
Interest Rate
4.07%
Mortgage Type
New Conventional
Estimated Equity
$255,632
Purchase Details
Closed on
Mar 26, 2010
Sold by
Bechtol Daniel J and Bechtol Olga A
Bought by
Bielskis Raymond J and Bielskis Kristyn Marie
Home Financials for this Owner
Home Financials are based on the most recent Mortgage that was taken out on this home.
Original Mortgage
$193,200
Interest Rate
4.35%
Mortgage Type
New Conventional
Create a Home Valuation Report for This Property
The Home Valuation Report is an in-depth analysis detailing your home's value as well as a comparison with similar homes in the area
Home Values in the Area
Average Home Value in this Area
Purchase History
| Date | Buyer | Sale Price | Title Company |
|---|---|---|---|
| Bielskis Raymond J | -- | -- | |
| Bielskis Raymond J | $241,500 | None Available |
Source: Public Records
Mortgage History
| Date | Status | Borrower | Loan Amount |
|---|---|---|---|
| Open | Bielskis Raymond J | $164,900 | |
| Closed | Bielskis Raymond J | $193,200 |
Source: Public Records
Tax History
| Year | Tax Paid | Tax Assessment Tax Assessment Total Assessment is a certain percentage of the fair market value that is determined by local assessors to be the total taxable value of land and additions on the property. | Land | Improvement |
|---|---|---|---|---|
| 2024 | $8,436 | $118,267 | $17,020 | $101,247 |
| 2023 | $7,881 | $112,432 | $16,180 | $96,252 |
| 2022 | $7,378 | $104,268 | $15,005 | $89,263 |
| 2021 | $5,926 | $82,711 | $14,364 | $68,347 |
| 2020 | $5,386 | $81,089 | $14,082 | $67,007 |
| 2019 | $5,410 | $78,537 | $13,639 | $64,898 |
| 2018 | $5,379 | $76,510 | $13,287 | $63,223 |
| 2017 | $5,271 | $76,510 | $13,287 | $63,223 |
| 2016 | $5,132 | $75,105 | $13,043 | $62,062 |
| 2015 | $4,873 | $72,705 | $12,626 | $60,079 |
| 2014 | $4,789 | $72,705 | $12,626 | $60,079 |
| 2013 | $4,907 | $73,640 | $12,788 | $60,852 |
Source: Public Records
Map
Nearby Homes
- 8894 Illinois 2
- 00 E Ashelford Dr Unit LOT 8
- 00 E Ashelford Dr
- 713 Birch St
- 8668 Yosemite Dr
- 509 N Walnut St
- 1574 Warrenton Dr
- 8890 Hales Corner Rd Rd
- 617 E 3rd St
- 1368 Joanne Terrace
- 2917 Everett Ln
- 1257 Glacier Dr
- 1245 Glacier Dr
- 932 W 2nd St
- 820 Crest View Trail
- 808 Crest View Trail
- 1903 Silverthorn Dr
- 309 Creekside Dr
- 265 Creekside Dr
- 00 White Tail Trail
- 4408 E Cascio Dr
- 4441 E Cascio Dr
- 4393 E Cascio Dr
- 4448 E Cascio Dr
- 4475 E Cascio Dr
- 4382 E Cascio Dr
- 4371 E Cascio Dr
- 9114 N Raven Crest Ln
- 4343 E Cascio Dr
- 4284 E Cascio Dr
- 4415 E Falcon Dr
- 4339 E Falcon Dr
- 4447 E Falcon Dr
- 4363 E Falcon Dr
- 4321 E Cascio Dr
- 4535 E Cascio Dr
- 4481 E Falcon Dr
- 9005 N Raven Crest Ln
- 4299 E Cascio Dr
- 9151 N Raven Crest Ln
Your Personal Tour Guide
Ask me questions while you tour the home.